

 Global| Nov 20 2026
Featured Data Additions, November 20, 2026
Summary
- Underlying inflation metrics for South Africa were added to EMERGEMA.
- Global semiconductor revenue statistics were added to GLSECTOR.
- Tourism statistics for Saudi Arabia were added to the TOURISM database.
EMERGEMA → South Africa → Prices → Underlying Inflation
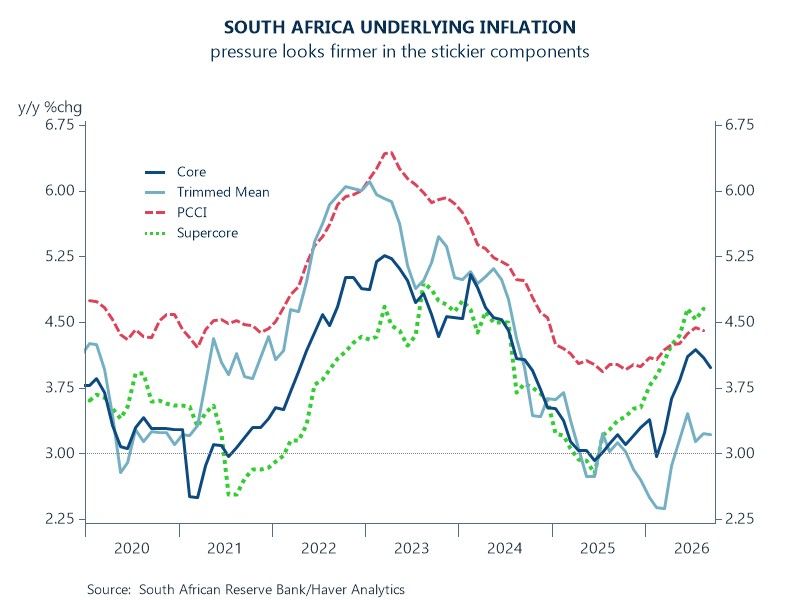
Underlying inflation metrics for South Africa were added to EMERGEMA. Series include core, trimmed mean and supercore inflation in addition to the persistent and common component of inflation (PCCI). Monthly data are sourced from the South African Reserve Bank (SARB) and start as early as 2018 with additional history calculated by Haver Analytics, where applicable.
Chart: All four underlying inflation measures remain above the SARB’s 3% target. Core was 3.98% y/y in September, down from a 4.19% peak in July. Trimmed mean was 3.22% and mainly flat since June. Supercore and the PCCI were higher as of August and still trending up. Supercore is at its highest since January 2024. The data are mixed for policy. Easing in the core and trimmed mean suggests the rebound is leveling off, while firmer supercore and PCCI readings point to persistence in the stickier components. The pattern is consistent with the SARB holding rates at a restrictive level while it waits for more evidence of disinflation.
GLSECTOR → Electrical Machinery, Apparatus & Appliances → Semiconductor Revenue → World
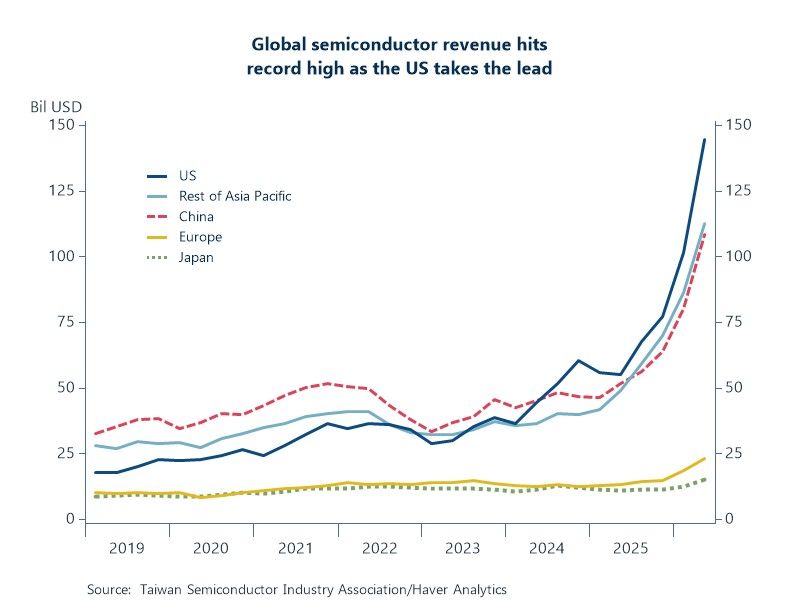
Global semiconductor revenue statistics were added to GLSECTOR. The table, reported in billions of USD, includes a world total with detail for Europe, the US, China, Japan and the rest of Asia Pacific. Quarterly data are sourced from the Taiwan Semiconductor Industry Association and start in Q1 2019.
Chart: Global semiconductor revenue reached $403 billion in Q2 2026. That is up 35% q/q, 124% y/y, and 4.1 times the Q2 2019 level. The geographical allocation has shifted. US revenue rose 163% y/y to $144.6 billion, lifting its share of the 5-region total from 18% in 2019 to 36% and accounting for about 40% of the past year’s increase. The US first overtook China in Q3 2024. China is still growing quickly (109% y/y), but its share has fallen from 34% to 27% since 2019. Europe and Japan are showing some growth in 2026, but they are growing far more slowly than the other regions, as their combined share has halved to 9% since 2019.
TOURISM → Countries and Special Areas → Saudi Arabia → Tourism Establishment Statistics
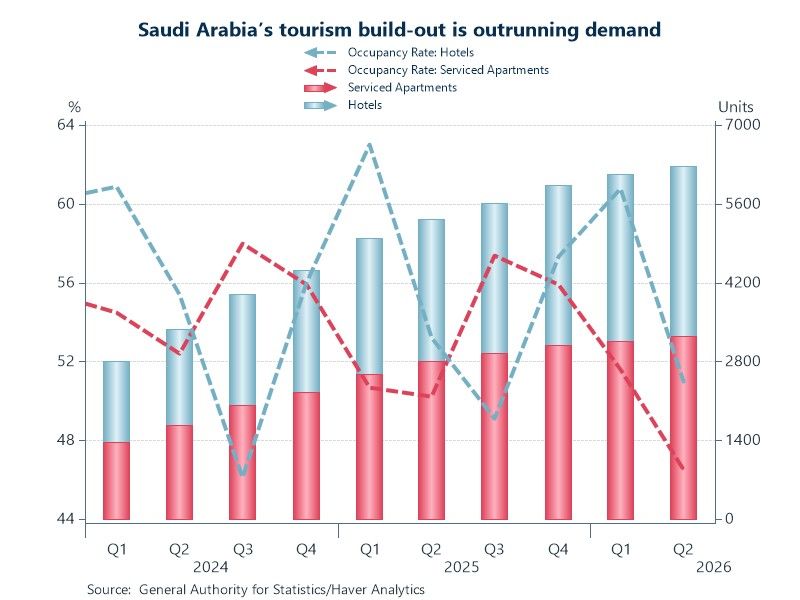
Tourism statistics for Saudi Arabia were added to the TOURISM database. Metrics related to stock of hospitality facilities, occupancy rates, average daily rates, length of stay, employment and number of tourism establishments are available on this table. Quarterly data are sourced from the General Authority for Statistics and start as early as Q1 2022.
Chart: Licensed hospitality facilities more than doubled from 2,802 in Q1 2024 to 6,278 in Q2 2026, up 18% y/y. Serviced apartments now outnumber hotels. Demand has not kept pace. Hotel occupancy fell to 51% in Q2 2026, down 2.2ppt y/y and 4.4ppt from Q2 2024. Serviced-apartment occupancy dropped to 46.5%, down 3.7ppt y/y and 5.9ppt from Q2 2024. Hotel average daily rates (not on the chart) slid 12% y/y following a 4% decline the year before. For now, operators face margin pressure, though the added capacity positions Saudi Arabia for the longer-term visitor growth the build-out anticipates.
More Featured Data Additions
 Global| Nov 03 2026
Featured Data Additions, November 3, 2026
 Global| Oct 27 2026
Featured Data Additions, October 27, 2026
 Global| Oct 21 2026
Featured Data Additions, October 21, 2026
 Global| Oct 14 2026