

 Global| Oct 21 2026
Featured Data Additions, October 21, 2026
Summary
- Fuel pricing statistics for Chile were added to the ENERGY and INTWKLY databases.
- Nice Cote D’Azur Airport statistics were added to the TRANSPRT database.
- The number of census families for Canada was added to the CANADA and CANADAR databases.
ENERGY → Petroleum → Petroleum Product Prices → Chile → Reference and Parity Fuel Prices
Fuel pricing statistics for Chile were added to the ENERGY and INTWKLY databases. Parity prices, plus high, intermediate and low reference prices for gasoline, diesel, kerosene and LPG are available on the table. Weekly prices per cubic meter are sourced from the Comision Nacional de Energia and start as early as January 1991, but most start in July 2012.
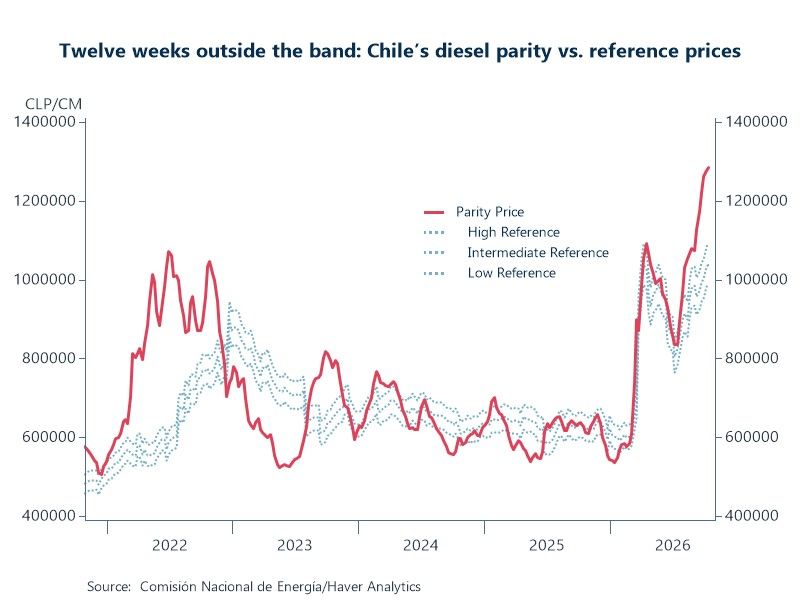
Chart: Chile’s diesel parity price has been running above the reference band for 12 consecutive weeks. Parity first breached the upper reference price in late July and has since climbed roughly 54% from its mid-July low to about 1.29 million CLP/CM in mid-October. The upper band has been adjusted higher over the same period, but only by about 29%, so the gap has widened from roughly 7% in early August to nearly 20% today. Parity remains far from the band, implying that Chile’s stabilization mechanism is absorbing a sizeable and growing share of the diesel price increase.
TRANSPRT → Air Traffic and Other Airline and Airport Statistics → Air Traffic by Country by Airport → France → Nice Côte d’Azur Airport
Nice Cote D’Azur Airport statistics were added to the TRANSPRT database. Concepts include passenger traffic, aircraft movements and cargo volume. Annual data are sourced from Aeroport Nice Cote D’Azur and start in 2014.
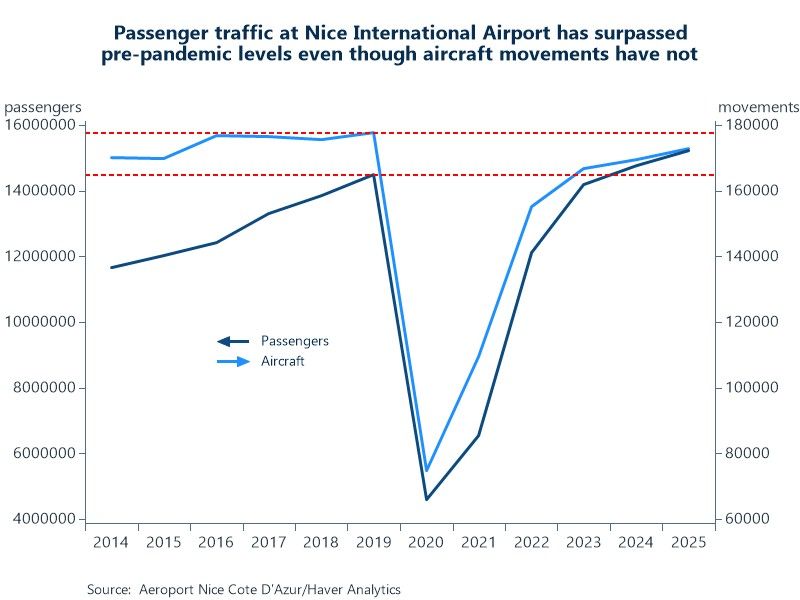
Chart: The pandemic hit Nice Côte d’Azur Airport harder than aircraft movements suggested. Movements fell 58% in 2020, compared with a 68% fall in passenger traffic. Fast forward 6 years, the airport has more than recovered its pre-pandemic passenger base even though it handles fewer flights. Passengers reached 15.2 million in 2025, 5.1% above 2019, while aircraft movements remained 2.7% below the 2019 peak. That works out to roughly 88 passengers per movement, up from about 82 in 2019, a sign of larger aircraft and/or higher load factors.
CANADA/CANADAR → Demographics → Census Families by Family Type (Table 17-10-0061)
The number of census families for Canada was added to the CANADA and CANADAR databases. These series are the official family counts based on the census statistics versus other sources of Canadian family counts such as tax filings. Detail is available for one-parent and couple families. Annual data are sourced from Statistics Canada and start in 2006.
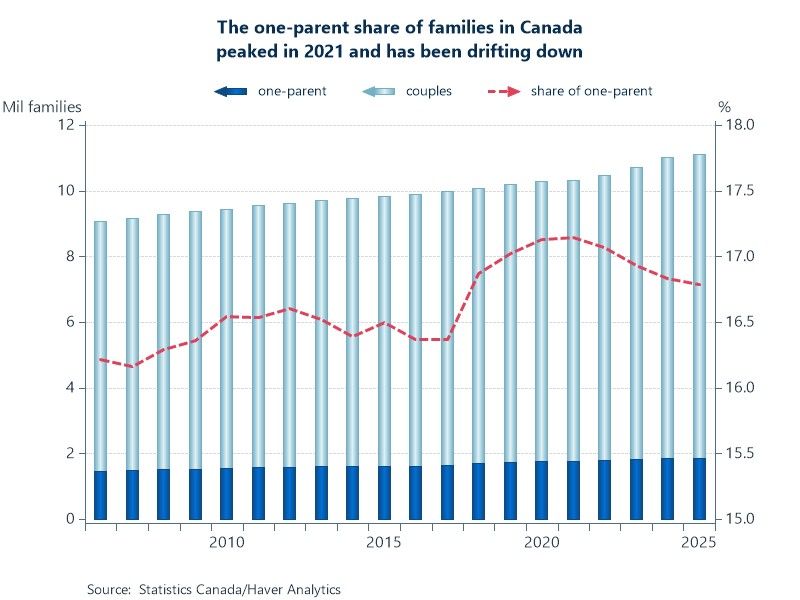
Chart: Roughly one in six Canadian families is headed by a single parent, a share that has barely changed in two decades. The one-parent share rose from 16.2% in 2006 to a peak of 17.1% in 2021, then eased to 16.8% in 2025. The recent decline reflects faster growth in couple families, which rose 8.0% between 2021 and 2025 against 5.3% for one-parent families. The timing coincides with the post-pandemic surge in immigration, which tends to add couples and larger family units. In absolute terms, one-parent families still number nearly 1.9 million, up about 400,000 since 2006.
More Featured Data Additions
 Global| Oct 14 2026
Featured Data Additions, October 14, 2026
 Global| Oct 07 2026
Featured Data Additions, October 7, 2026
 Global| Sep 23 2026
Featured Data Additions, September 23, 2026
 Global| Sep 18 2026