

 Global| Nov 03 2026
Featured Data Additions, November 3, 2026
Summary
- Climate policy uncertainty indexes for Pakistan were added to EMERGEPR.
- Online payment statistics for South Korea were added to INTWKLY.
- World Bank fiscal space statistics were added to WDI.
EMERGEPR → Pakistan → Cyclical Indicators and Surveys → Climate Policy Uncertainty Index
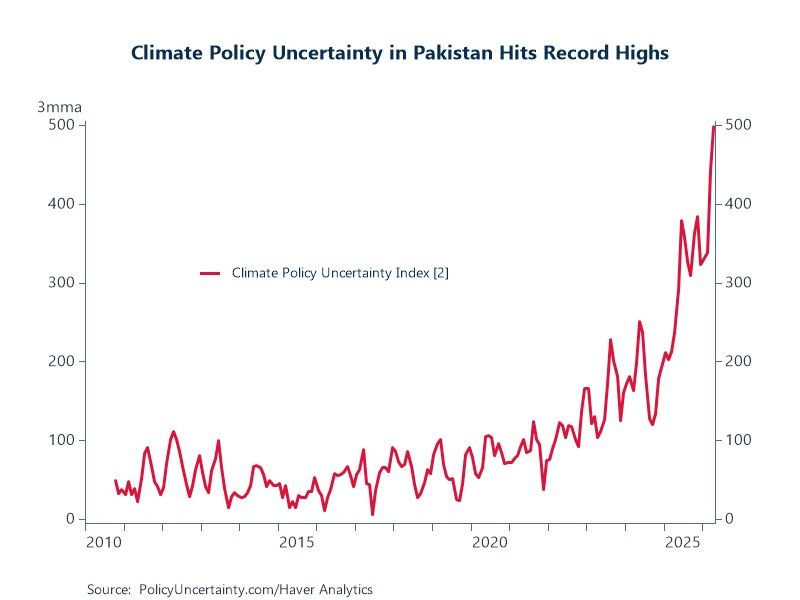
Climate policy uncertainty indexes for Pakistan were added to EMERGEPR. These indexes measure levels of uncertainty related to climate policies, regulations, and government actions that affect households, firms, investors, and the economy. They are derived by obtaining counts of articles from sets of newspapers that contain specific keywords. Monthly data are sourced from PolicyUncertainty.com. The 2- and 4-newspaper indexes start in August 2010 and January 2015, respectively.
Chart: Climate policy uncertainty in Pakistan has risen markedly since 2020 and reached record levels in April 2026. On a 3-month moving average basis, the 2-newspaper index rocketed to 498 in April, up from 442 in March. From 2010 to 2020, the index fluctuated around lower, trendless levels. The index first crossed 200 in August 2023, 300 in June 2025 and has been above that level since. Sustained climate policy uncertainty could undermine Pakistan’s already modest growth and weigh on investment and planning in climate-exposed sectors such as agriculture, energy and infrastructure.
INTWKLY → Asia and Australasia → South Korea → Online Payments
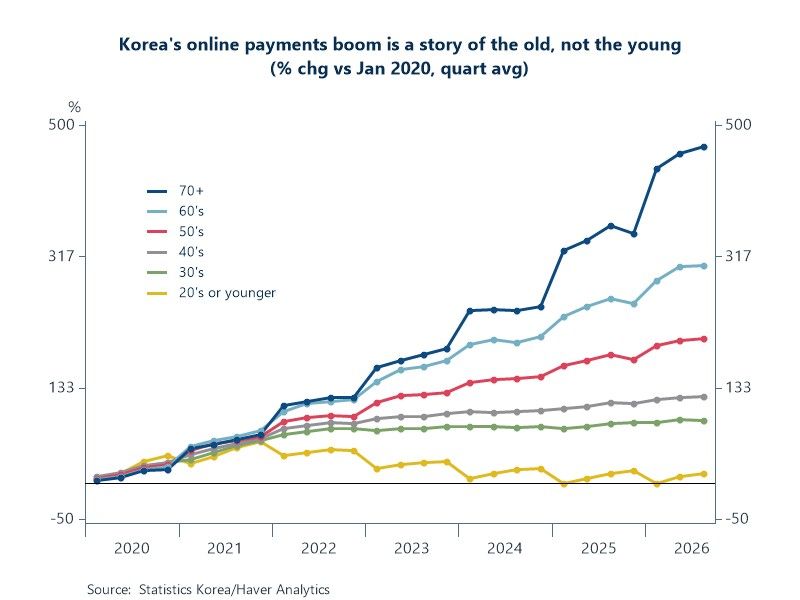
Online payment statistics for South Korea were added to INTWKLY. Volume and value percent changes relative to January 2020, previous week, 4 weeks prior, and 52 weeks prior are available by sex and age group. Weekly data are sourced from Statistics Korea and start in January 2020.
Chart: Online payment volumes in Korea have roughly doubled since January 2020, but the gains are unevenly spread across age groups. For those aged 70+, it is running 470% above its January 2020 level in Q3 2026. For those in their 60s the figure is about 300%, and for those in their 50s about 200%. The 40s and 30s have grown more modestly and for 20 and younger, it is only about 14% - the weakest of any cohort. Young Koreans were likely already digital-first in 2020, so adoption gains accrued to cohorts that started from a lower base. The gains for older Koreans are also large enough that they may reflect rising digital adoption in an ageing population.
WDI → Cross Country Database of Fiscal Space
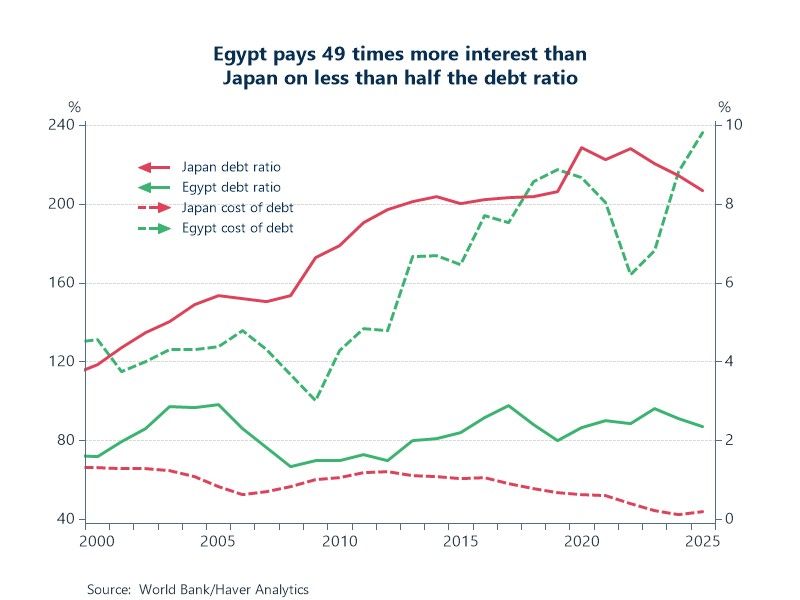
World Bank fiscal space statistics were added to WDI. Broadly defined, fiscal space is the availability of budgetary resources for a government to service its financial obligations. This data set covers 204 countries and includes 29 indicators of fiscal space grouped into 4 categories: government debt sustainability, balance sheet composition, external and private sector debt, and market access. Annual data start in 1990.
Chart: Japan has one of the highest debt ratios at 207% of GDP in 2025. Egypt’s debt ratio comes in at 87%. On the cost of that debt, the picture changes. Egypt’s implied interest bill of 9.8% of GDP is the highest of all, while Japan’s 0.2% is one of the lowest. Egypt pays roughly 49 times more interest on less than half the debt ratio. While Japan holds a much larger absolute mountain of debt, it benefits from rock-bottom historical interest rates and immense local wealth, allowing it to navigate its obligations with far less fiscal distress than Egypt.
More Featured Data Additions
 Global| Oct 27 2026
Featured Data Additions, October 27, 2026
 Global| Oct 21 2026
Featured Data Additions, October 21, 2026
 Global| Oct 14 2026
Featured Data Additions, October 14, 2026
 Global| Oct 07 2026