

 Global| Oct 27 2026
Featured Data Additions, October 27, 2026
Summary
- Government gross financing statistics for Fiji were added to the EMERGEPR database.
- The Leverage Requirements Return (LRR) statistics were added to CANADA.
- Insolvency statistics for Australia were added to the INTDAILY and INTWKLY databases.
EMERGEPR → Fiji → Public Finance and Debt → Government Gross Financing
Government gross financing statistics for Fiji were added to the EMERGEPR database. The table includes a breakout by local and foreign financing with some detail for each. These data reported in millions of Fijian dollars are sourced from the Reserve Bank of Fiji. Annual data start in 1992 while monthly data start in January 2025.
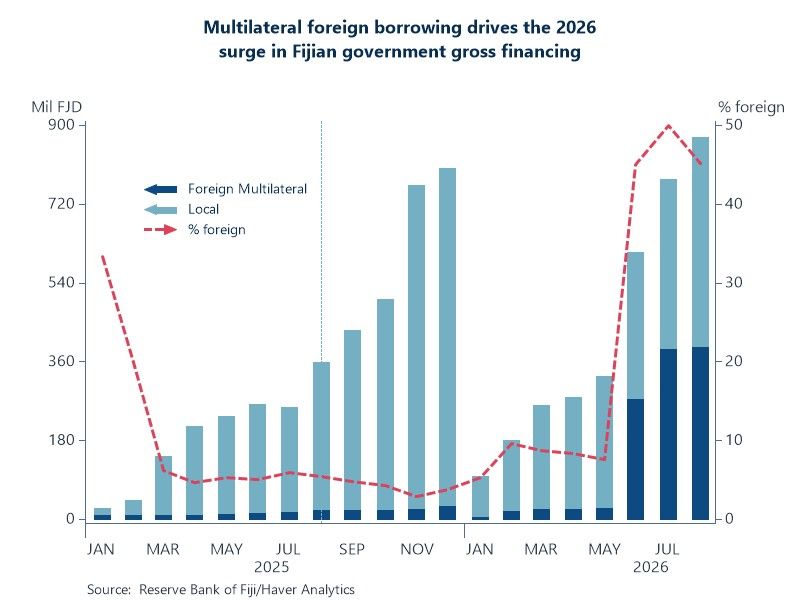
Chart: Fiji’s government gross financing reached FJD 873 million in Jan–Aug 2026, up from FJD 358 million a year earlier and already above the FJD 802 million raised in all of 2025. The composition has shifted. Government financing was almost entirely local in 2025, with foreign sources supplying only about FJD 30 million (under 4%) for the whole year. Foreign financing has been FJD 394 million so far in 2026, or 45% of the total – concentrated in June and July. This coincides with the approval of World Bank and AIIB (Asian Infrastructure Investment Bank) budget-support operations.
CANADA → Financial → OSFI Leverage Requirements Return
The Leverage Requirements Return (LRR) statistics were added to CANADA. The LRR is a regulatory filing that Canadian deposit-taking institutions submit reporting leverage ratios along with the details of how it was calculated. Exposures and Tier 1 capital measures for all banks, domestic banks and foreign bank subsidiaries are available. Quarterly data are sourced from the Office of the Superintendent of Financial Institutions and start in Q1 2018.
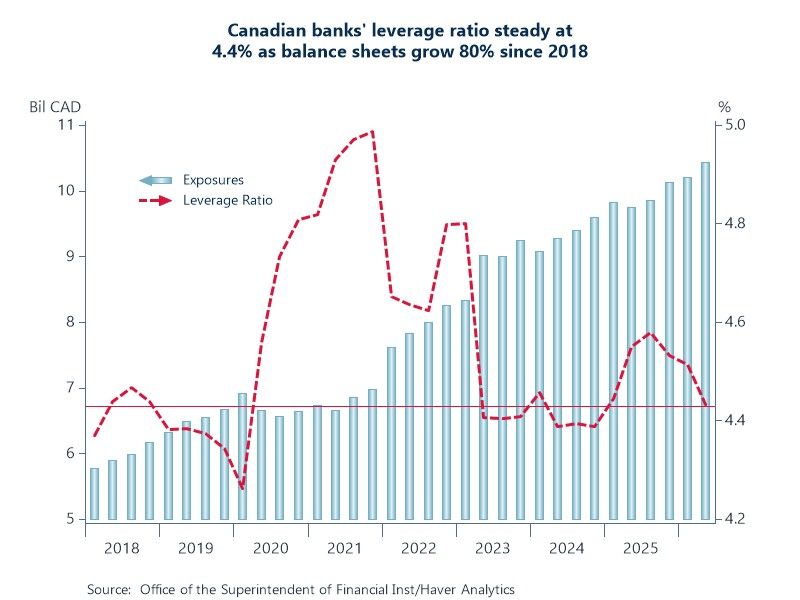
Chart: Canadian banks’ balance sheets have grown by 80% since 2018, with exposures rising from 5.8 trillion CAD to 10.4 trillion CAD. Tier 1 capital has kept pace, leaving the system-wide leverage ratio at 4.4%, almost unchanged from 2018. However, the path has not been smooth. The ratio climbed to nearly 5% by late 2021, then stepped down in 2022 and again in 2023. Looking at the detail, domestic banks account for virtually all of the system (99.6%), so their ratio mirrors the aggregate. Foreign bank subsidiaries have a leverage ratio near 12%, but hold less than half a percent of exposures.
INTDAILY/INTWKLY → Asia and Australasia → Australia → Insolvency Statistics
Insolvency statistics for Australia were added to the INTDAILY and INTWKLY databases. Series 1 and series 2 data by appointment type are available on this table. Simply put, series 1 differs from series 2 in the way insolvencies are counted, where series 2 may include some double-counting. Daily data are sourced from the Australian Securities and Investments Commission and start in July 2021.
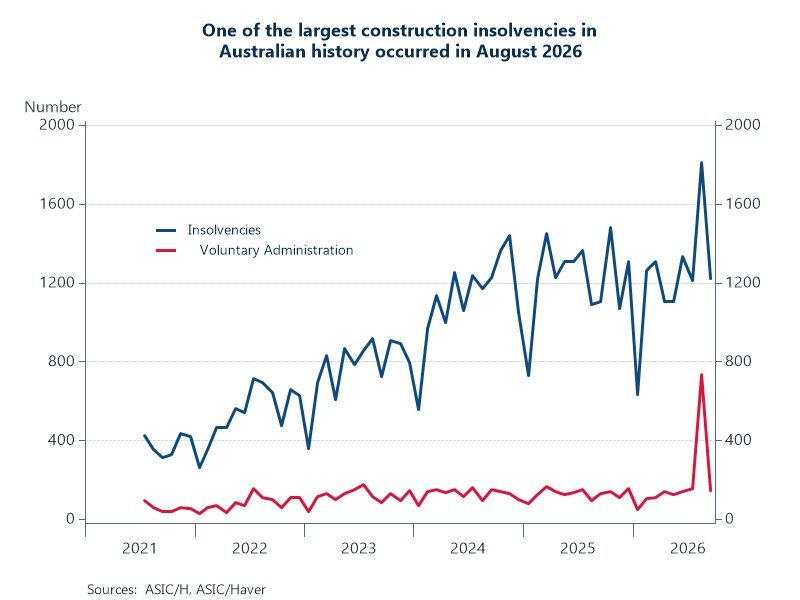
Chart: Australian insolvency appointments have stopped climbing but remain historically elevated. Over the past year, appointments are basically flat. The latest data are distorted by a single event – the collapse of Bathla Group. On August 25, 587 voluntary administrations (VA) were recorded, lifting August to a record 1,808 appointments. Bathla Group entered VA with debts reported at A$3.4 billion across 542 individual companies, one of the largest construction insolvencies in Australian history. This collapse will have national implications for some time to come, affecting subcontractors, trade creditors, private credit lenders, and off-the-plan buyers across Australia.
More Featured Data Additions
 Global| Oct 21 2026
Featured Data Additions, October 21, 2026
 Global| Oct 14 2026
Featured Data Additions, October 14, 2026
 Global| Oct 07 2026
Featured Data Additions, October 7, 2026
 Global| Sep 23 2026