 Global| Dec 18 2025
Charts of the Week: The Upside Risks
by:Andrew Cates
|in:Economy in Brief
Summary
This marks our final Charts of the Week publication for 2025 The next edition will be released on Thursday 8 January.
Last week’s Charts of the Week focused on the darker tail risks hanging over the 2026 outlook: the possibility of monetary policy mis-calibration, that geopolitics and trade fragmentation further disrupt supply chains, and that elevated debt levels—particularly in the public sector—reassert themselves as a drag on growth. This week’s charts take a deliberately different tack. Taken together, they highlight a set of upside risks that are possibly underappreciated in current forecasts. For example, policy easing across advanced economies may extend further than expected as disinflation feeds on itself (chart 1); oil prices could surprise on the downside as inventories rebuild (chart 2); US productivity may deliver incremental but meaningful gains sooner than assumed (chart 3); the US economy itself could continue to benefit from an absence of private-sector financial stress (chart 4); India’s growth momentum might firm again as inflation pressures recede (chart 5); and, more broadly, parts of the Global South appear increasingly capable of generating their own demand impulse, supported by favourable demographics and income growth (chart 6). None of these forces is guaranteed, and each carries its own caveats—but together they suggest that, having spent much of the past year fixated on downside risks, the risks to global growth in 2026 may be more evenly balanced than is widely assumed.
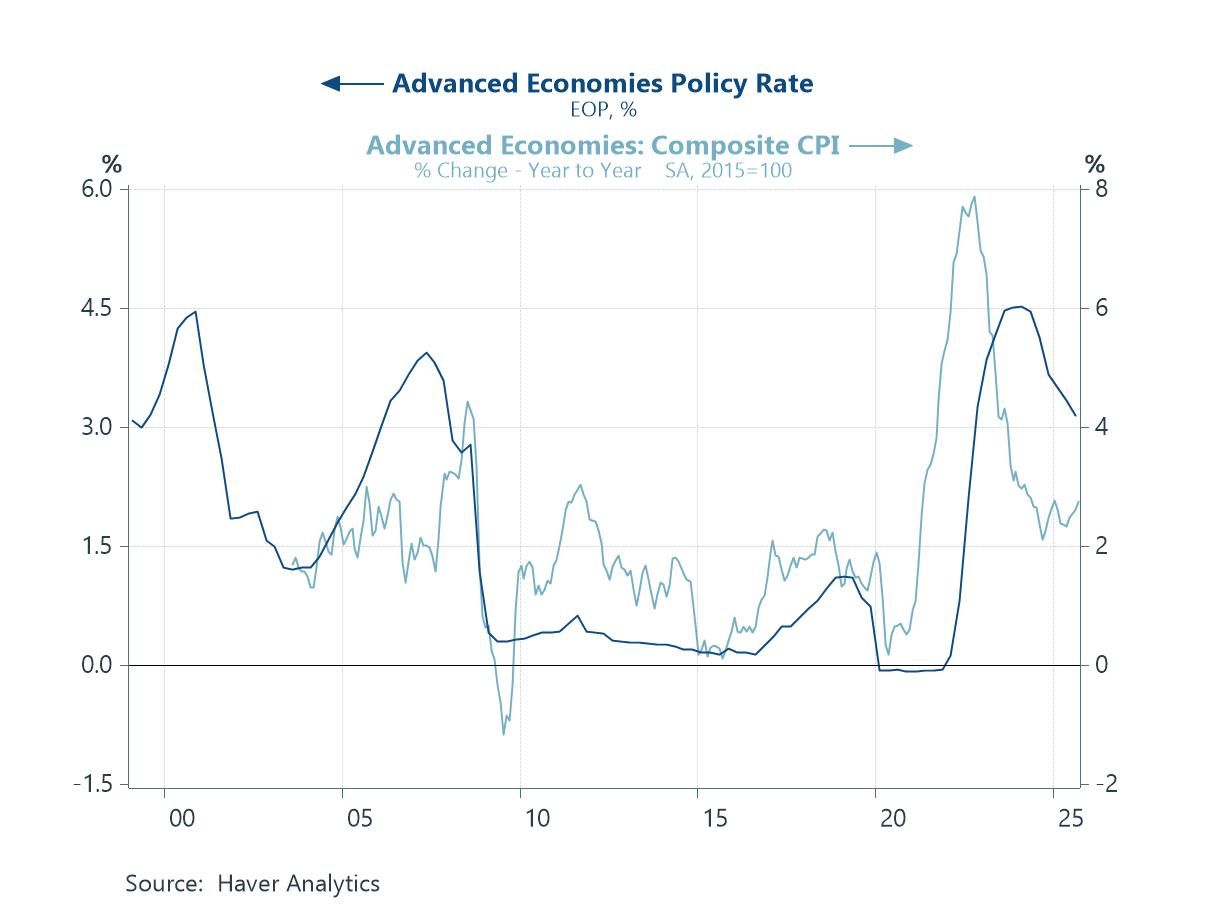
Faster-than-Expected Monetary Easing Our first potential upside risk for 2026 is that monetary policy across most major advanced economies is loosened further and by more than markets and forecasters currently anticipate. Monetary policy cycles have a history of being underestimated in both length and magnitude—in large part because of the powerful feedback loops between interest rates, inflation, and economic behaviour. On the way up, higher policy rates feed into mortgage costs, debt-service burdens, rents, and the general cost of doing business, reinforcing wage pressures and inflation persistence. But these same channels work in reverse on the way down. As rates fall, debt servicing eases, housing and rental inflation softens, and cost pressures across the economy unwind more rapidly than expected—allowing inflation to decelerate faster and creating scope for further easing. A risk, therefore, is that if disinflation becomes self-reinforcing, central banks find themselves cutting rates more aggressively than currently priced, not because of economic distress, but because restrictive policy proves increasingly unnecessary.
Chart 1: Advanced Economies: Aggregate policy rate versus headline CPI inflation
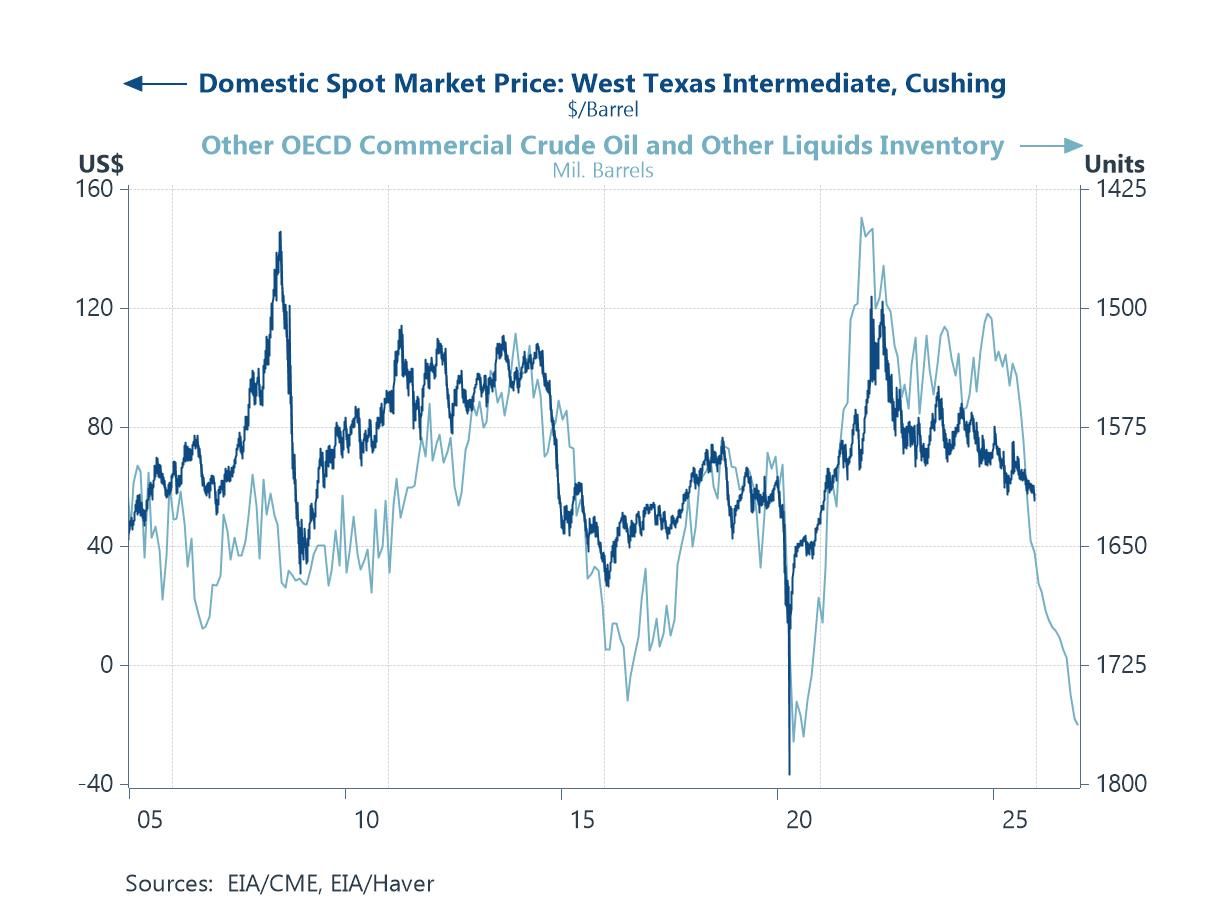
Energy Supply Dynamics Prove More Supportive The second chart reinforces the message from the first: easing monetary policy may be accompanied—and amplified—by a more benign energy backdrop. Recent projections from the EIA point to a renewed build-up in OECD crude oil and liquids inventories over the year ahead, a dynamic that has historically been associated with downward pressure on oil prices. If inventories continue to rise as supply growth outpaces demand, spot prices for crude could undershoot current forecasts, keeping energy inflation subdued. That, in turn, would reinforce disinflationary forces already in play—lowering headline CPI, easing cost pressures for firms and households, and giving central banks greater confidence to loosen policy further. In that sense, softer oil prices would not just be a standalone positive shock, but part of a reinforcing feedback loop alongside rate cuts, supporting real incomes, financial conditions, and global growth into 2026.
Chart 2: Oil prices versus EIA estimates of and forecasts for OECD countries’ inventory of oil
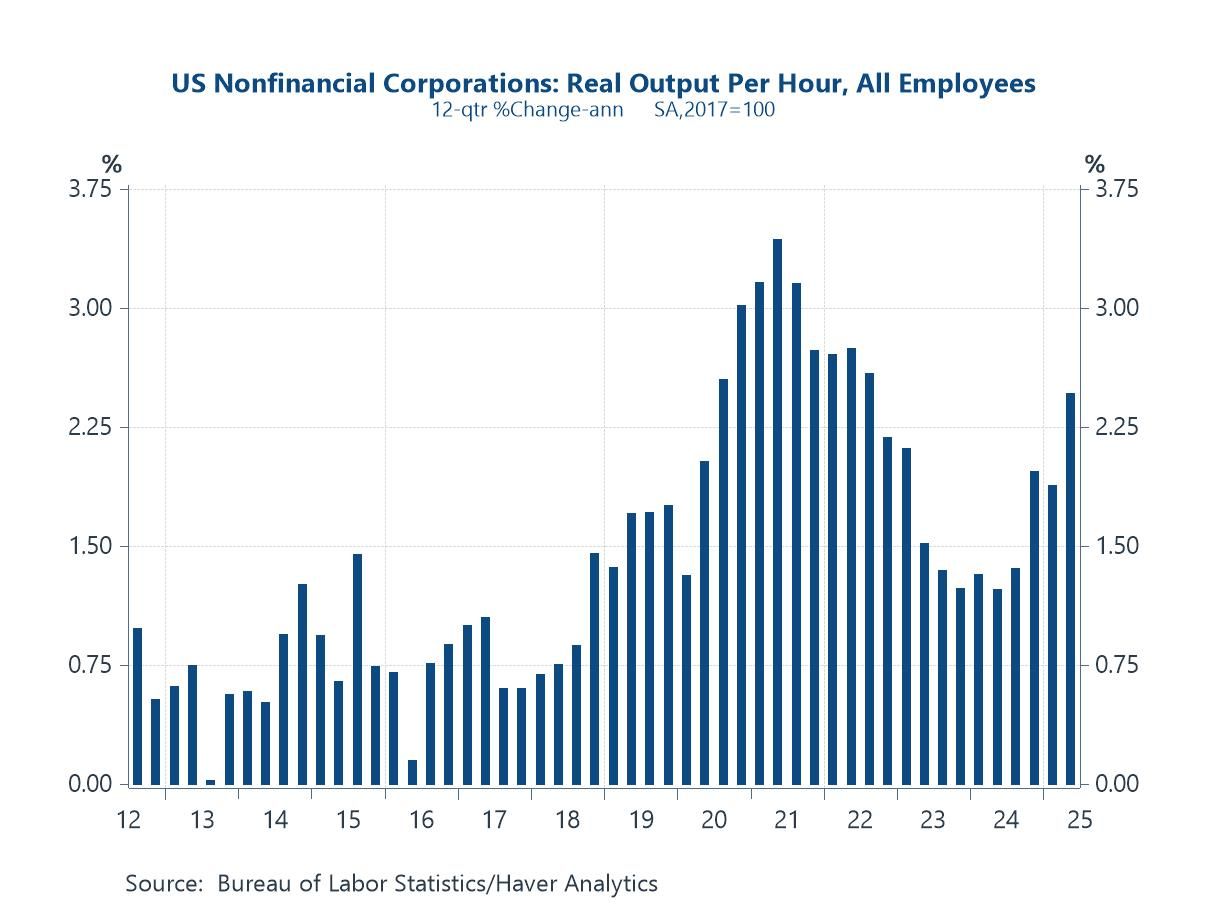
AI-Driven Productivity Gains Materialise More Quickly The third chart shows a clear pickup in US nonfinancial productivity growth, reviving the debate around whether AI-driven efficiency gains may arrive sooner than many forecasters expect. While the longer-term productivity potential of AI remains uncertain and uneven across sectors, there are reasons to think that at least some near-term gains could prove more tangible than currently assumed. Rather than transformative breakthroughs, early benefits are likely to come from incremental improvements—automation of routine processes, better scheduling and logistics, more efficient use of capital and labour, and modest reductions in overhead costs—areas where US firms are already well positioned to implement new technologies quickly. If these gains accumulate and diffuse more broadly, the implications would still be meaningful. Even a modest, sustained uplift in productivity would help contain unit labour costs, support real income growth, and raise the economy’s speed limit without generating renewed inflation pressure. In that scenario, productivity would not need to “revolutionise” the economy to matter: incremental efficiency gains could nonetheless provide a supportive backdrop for growth, earnings, and policy easing into 2026—representing a genuine upside risk to the outlook.
Chart 3: US non-financial productivity growth, 3-year % change
The US Economy Proves Resilient Again The next chart highlights a further upside risk to the 2026 outlook: the possibility that the US economy once again outperforms its peers. Unlike the typical pre-recession backdrop, there is little evidence of meaningful financial stress in the US private sector. After a prolonged period of balance-sheet repair, private-sector debt ratios have been trending lower in recent years, while the sector as a whole is running a healthy financial surplus. This stands in stark contrast to previous late-cycle episodes, which were characterised by rising leverage, widening deficits, and growing dependence on credit expansion. The absence of private-sector excesses reduces the economy’s vulnerability to higher rates and external shocks, and helps explain why growth has remained more durable than expected. If households and firms continue to prioritise balance-sheet strength rather than forced deleveraging, the usual mechanisms that tip the economy into recession may fail to materialise. In that environment, even modest easing in financial conditions could translate into renewed spending and investment, allowing the US to sustain above-trend growth into 2026—representing another upside risk to the global outlook.
Chart 4: US private sector debt versus the private sector’s financial balance

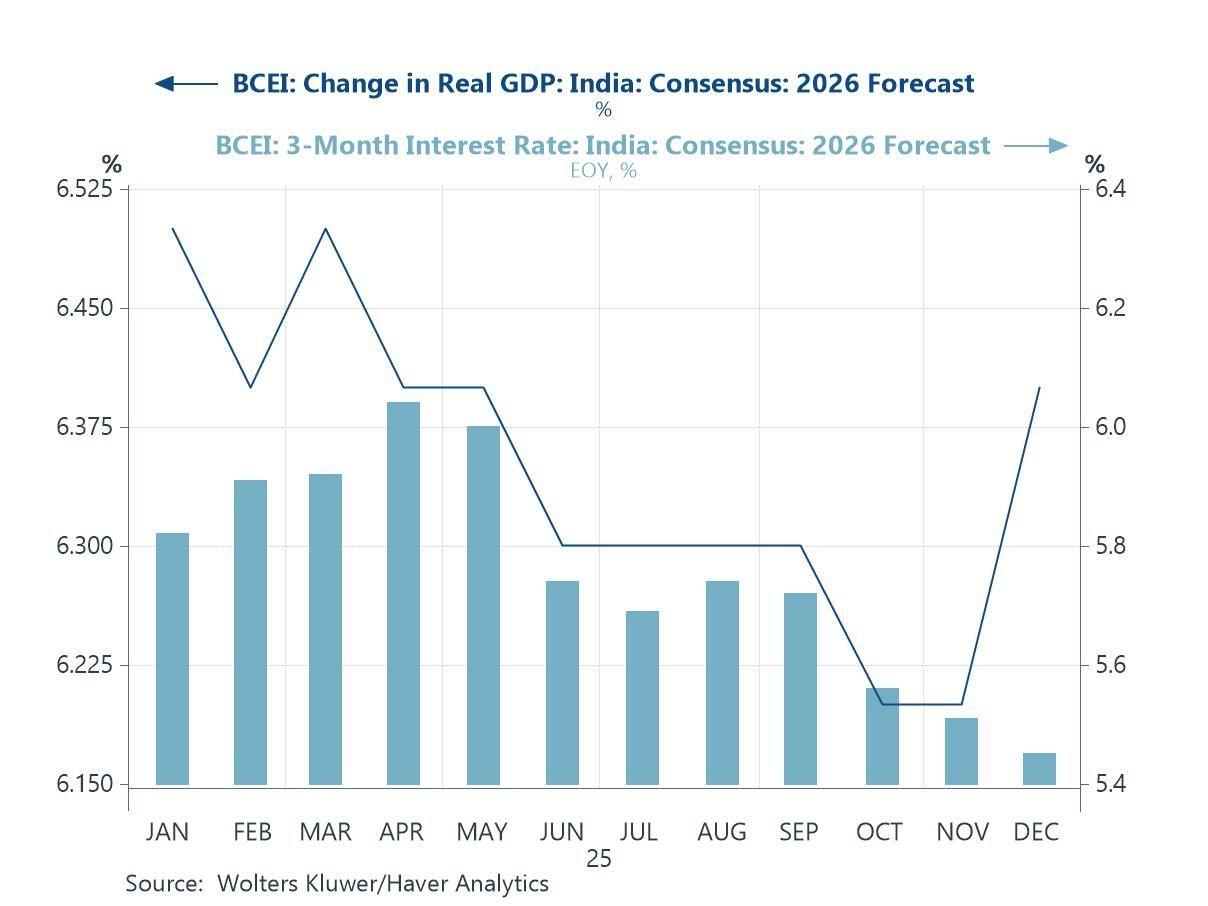
India’s Growth Engine Accelerates Further Chart 5 points to another potential upside risk for 2026 emanating from India’s economy. After a period of relative pessimism earlier in the year, consensus growth forecasts for 2026 have been revised modestly higher, even as inflation projections have continued to drift lower. This combination—firmer growth expectations alongside easing inflation pressures—creates scope for a more supportive policy backdrop than markets currently assume. With real interest rates no longer rising and financial conditions stabilising, India’s investment cycle, already underpinned by public infrastructure spending and improving corporate balance sheets, could prove more durable than forecast. If these trends persist, India may deliver growth that is both stronger and more internally driven than expected, providing a meaningful demand impulse to the broader global economy. Given India’s increasing weight in global growth, even small upside surprises would have outsized effects on trade, commodity demand, and regional activity—reinforcing the case that the global outlook for 2026 may be skewed to the upside.
Chart 5: Blue Chip Consensus Forecasts for India in 2026: GDP growth versus CPI inflation
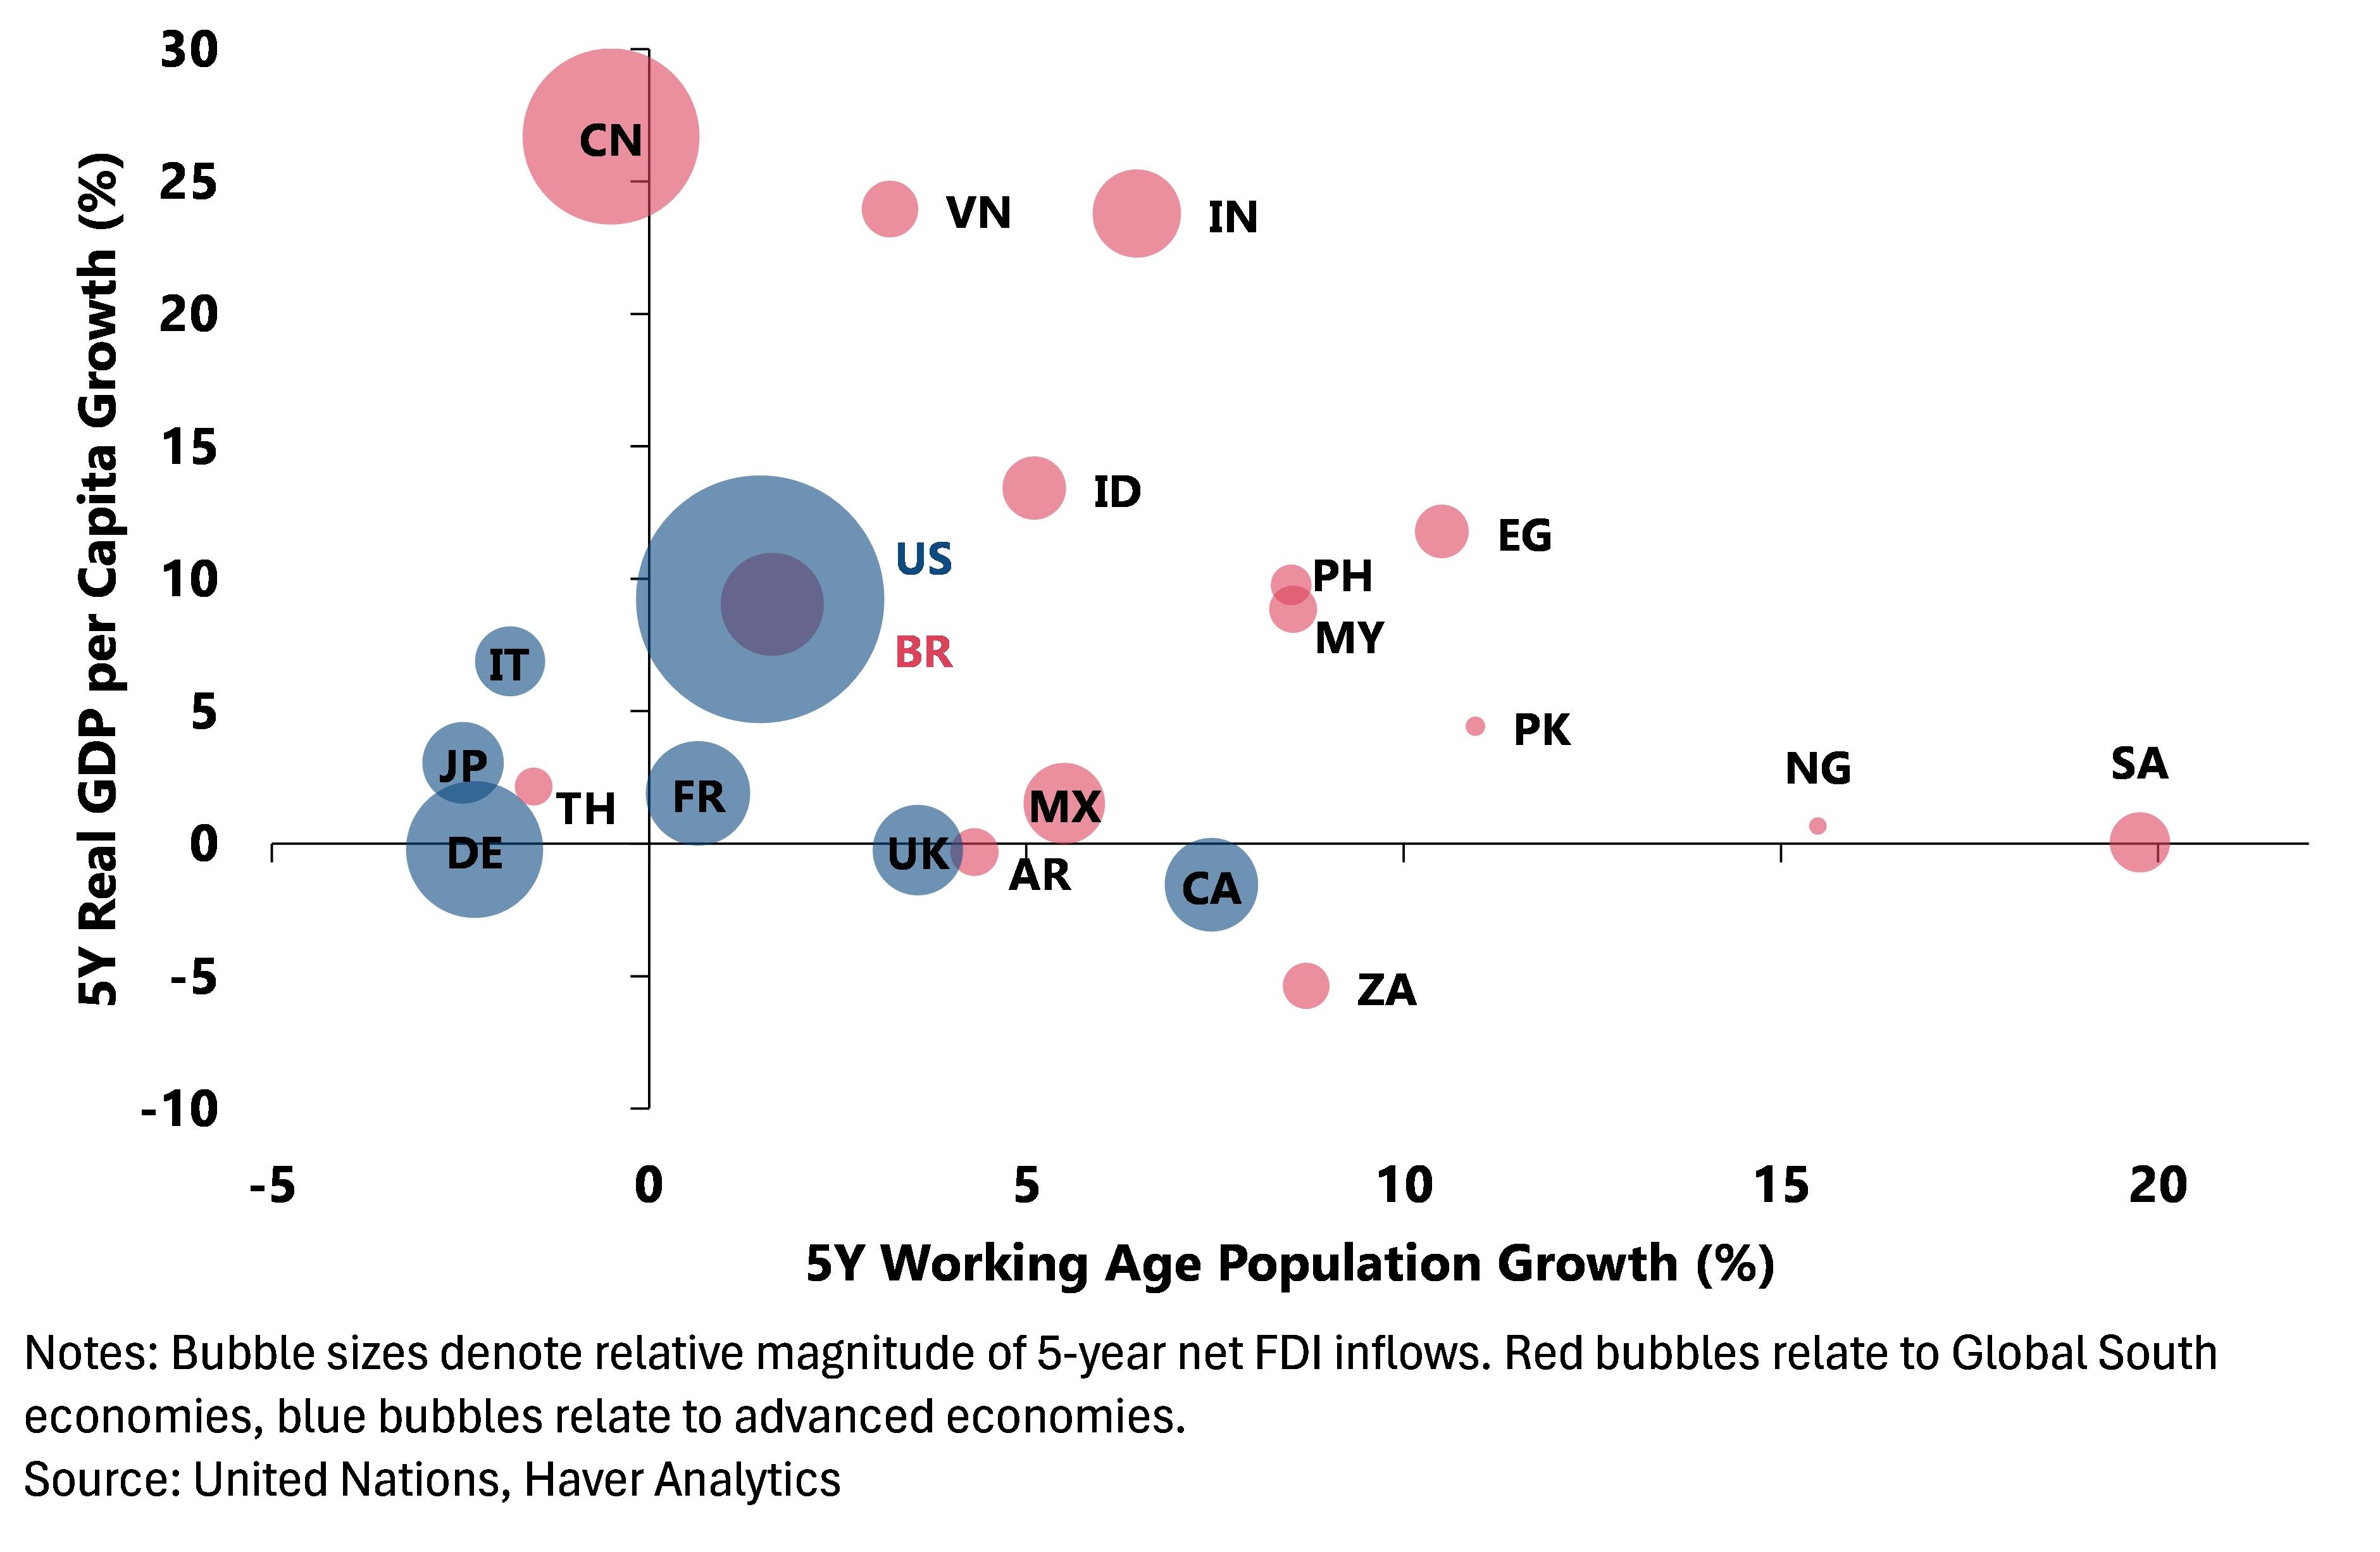
The Global South Becomes a More Independent Source of Demand The final chart points to a broader upside risk for the global economy in 2026: that economies across the so-called Global South generate more durable momentum than currently assumed. With a few notable exceptions—such as China and Thailand—many emerging economies continue to benefit from stronger growth in their working-age populations and/or faster real GDP per capita growth than their advanced-economy counterparts. These demographic and income dynamics are helping to underpin domestic consumption, support labour-force expansion, and attract capital inflows, as reflected in the pattern of net FDI across countries. In contrast, much of the advanced world faces binding demographic constraints and lower steady-state growth rates, limiting the scope for demand to re-accelerate organically. If growth in the Global South proves more resilient and internally driven—rather than overly dependent on exports to advanced economies—it could provide a more stable and geographically diversified source of global demand. In that scenario, global growth in 2026 would be less reliant on a narrow set of advanced economies, reinforcing the case that risks to the outlook may be skewed to the upside.
Chart 6: Global South versus Developed Economies: Growth, Demographics and FDI flows

Andrew Cates
AuthorMore in Author Profile »Andy Cates joined Haver Analytics as a Senior Economist in 2020. Andy has more than 25 years of experience forecasting the global economic outlook and in assessing the implications for policy settings and financial markets. He has held various senior positions in London in a number of Investment Banks including as Head of Developed Markets Economics at Nomura and as Chief Eurozone Economist at RBS. These followed a spell of 21 years as Senior International Economist at UBS, 5 of which were spent in Singapore. Prior to his time in financial services Andy was a UK economist at HM Treasury in London holding positions in the domestic forecasting and macroeconomic modelling units. He has a BA in Economics from the University of York and an MSc in Economics and Econometrics from the University of Southampton.
More Economy in Brief


