 Global| Oct 16 2025
Charts of the Week: Momentum With Caveats
by:Andrew Cates
|in:Economy in Brief
Summary
Global financial markets are entering mid-October with a cautiously optimistic tone, supported by a mix of better macro data and easing geopolitical risk. This week’s latest IMF forecasts nudged global growth expectations higher for 2025, broadly in line with indication from the latest Blue Chip consensus, where revisions have been led by economies tied to the tech and semiconductor cycle (chart 1). That same dynamic is evident in the US, where surging AI-driven data-center investment has emerged as an unexpectedly powerful growth driver (chart 2). Still, the timing of AI’s broader payoff remains uncertain—forecasters see labor-market disruption coming before a measurable productivity boost, underscoring an important macro risk if investment runs ahead of realized gains (chart 3). On the geopolitical front, the announcement of peace in Gaza this week has also pushed global oil prices down, providing a welcome disinflationary impulse (chart 4). At the same time, US–China trade tensions remain troubling. China’s export growth in September was stronger than expected but with gains concentrated in ASEAN and the EU, while shipments to the US continue to contract (chart 5). Meanwhile, in the UK, signs of a loosening labor market have added to expectations that the Bank of England could deliver further rate cuts in the months ahead (chart 6). Against this backdrop—buoyed by AI optimism but clouded by policy uncertainty around the US government shutdown, US–China frictions, and execution risks on technology—the global outlook has brightened modestly, but remains finely balanced.
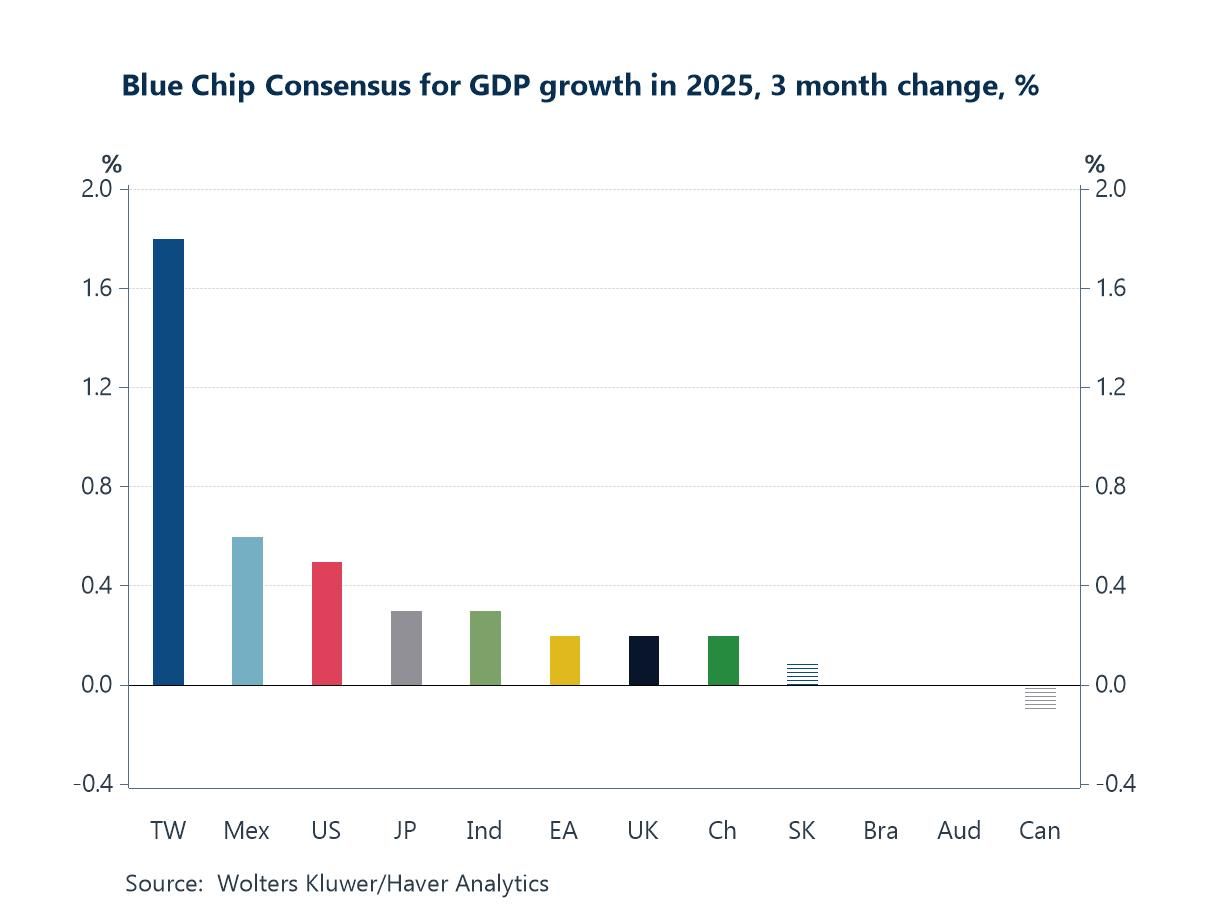
The Blue Chip Consensus for 2025 Blue Chip forecasters have nudged 2025 growth higher over the past three months, led by a striking upgrade for Taiwan—consistent with the semiconductor upcycle—while Mexico and the US also see solid upward revisions and more modest gains appear across Japan, India, the euro area, the UK and China. Only Canada slips slightly, with Australia and Brazil broadly flat, leaving the balance of changes clearly positive. This pattern chimes with the recent run of stronger-than-expected global data—resilient US demand, a stabilizing Europe, and firmer Asian tech trade—and echoes this week’s IMF update, which delivered modest upward tweaks to the 2024 global growth outlook versus July. In short, consensus is leaning toward a sturdier 2025 expansion than it was in mid-summer, with the upside concentrated where external demand and tech-cycle tailwinds are most evident, and only a handful of commodity- and rate-sensitive economies lagging.
Chart 1: The Blue Chip Consensus for GDP growth in 2025, 3-month change
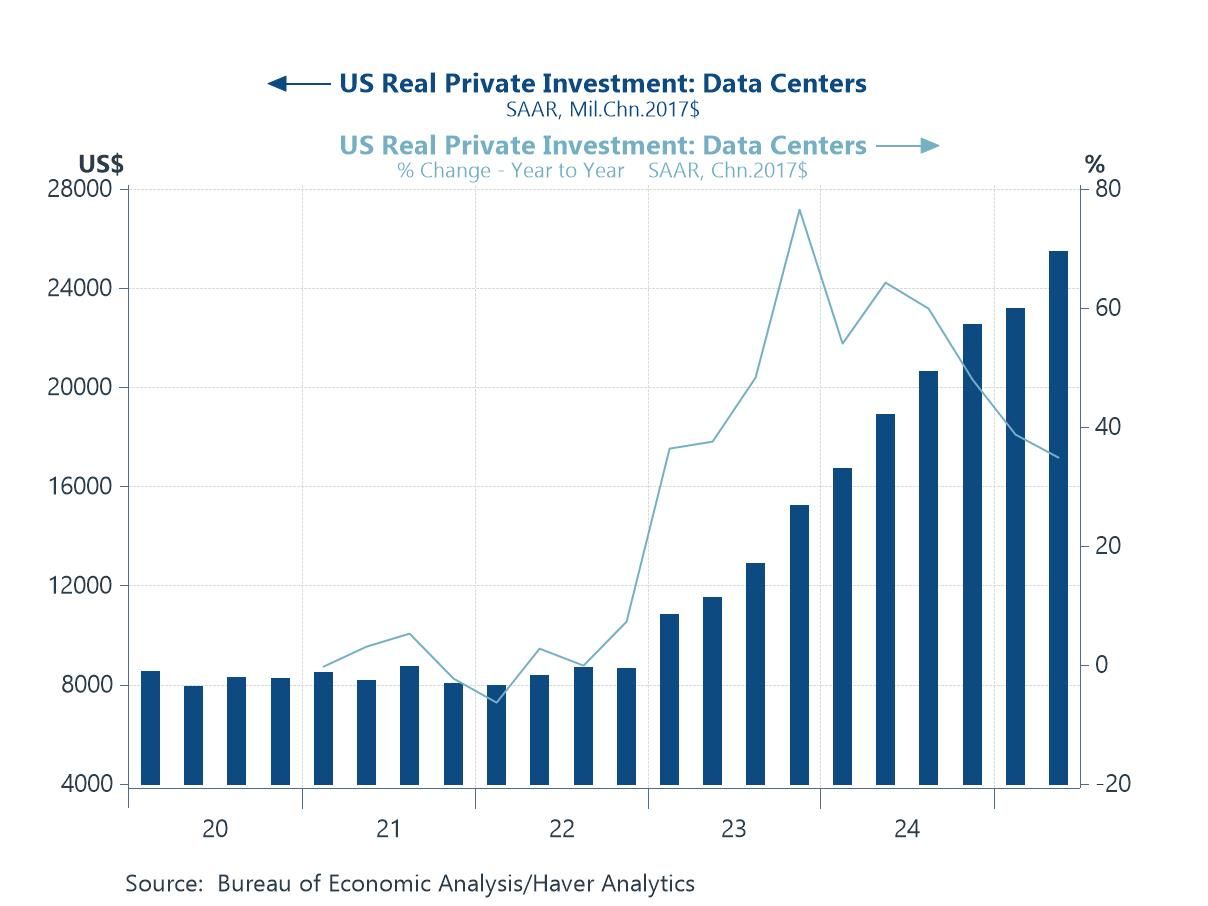
The US economy and AI That tech-tailwind shows up most clearly in the US, where the semiconductor upcycle is feeding directly into an AI-infrastructure boom. Real private investment in data centers has surged—an arms race to stand up AI capacity—making it one of the biggest (and least anticipated) contributors to US capex and GDP in recent quarters. The step-change since 2023 is striking: spending has climbed well beyond its pre-AI trend while year-on-year growth has remained elevated, reflecting orders for servers and accelerators, grid connections, specialized construction, and associated software and networking. In short, the same forces lifting Taiwan’s outlook are echoing through US investment via data-center build-out, helping to prop up aggregate growth even as other business spending lines look more pedestrian.
Chart 2: US Investment in Data Centres
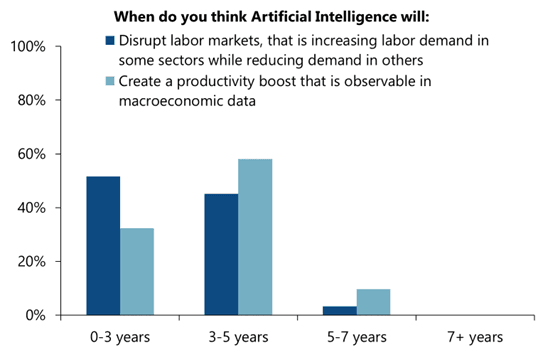
AI and productivity The rub, of course, is whether this investment wave translates into productivity—and when. In the latest Blue Chip Economic Indicators survey, respondents think labor-market disruption will arrive before macro-visible efficiency gains: around half expect AI to reshape labor demand within 0–3 years, but fewer see a measurable productivity boost on that horizon; most place that in 3–5 years, with a meaningful tail beyond. That timing gap is the core risk—capex and workforce churn arrive early while the payoff lags—leaving growth flattered by construction and equipment rather than true total factor productivity. Diffusion outside tech, skills and organizational change, data quality, and energy/grid constraints all raise the execution bar. In short, the macro story hinges on whether today’s AI build-out converts into broad, measured productivity before the cycle—or policy patience—runs thin.
Chart 3: Blue Chip Survey responses on AI’s labour market and productivity impact
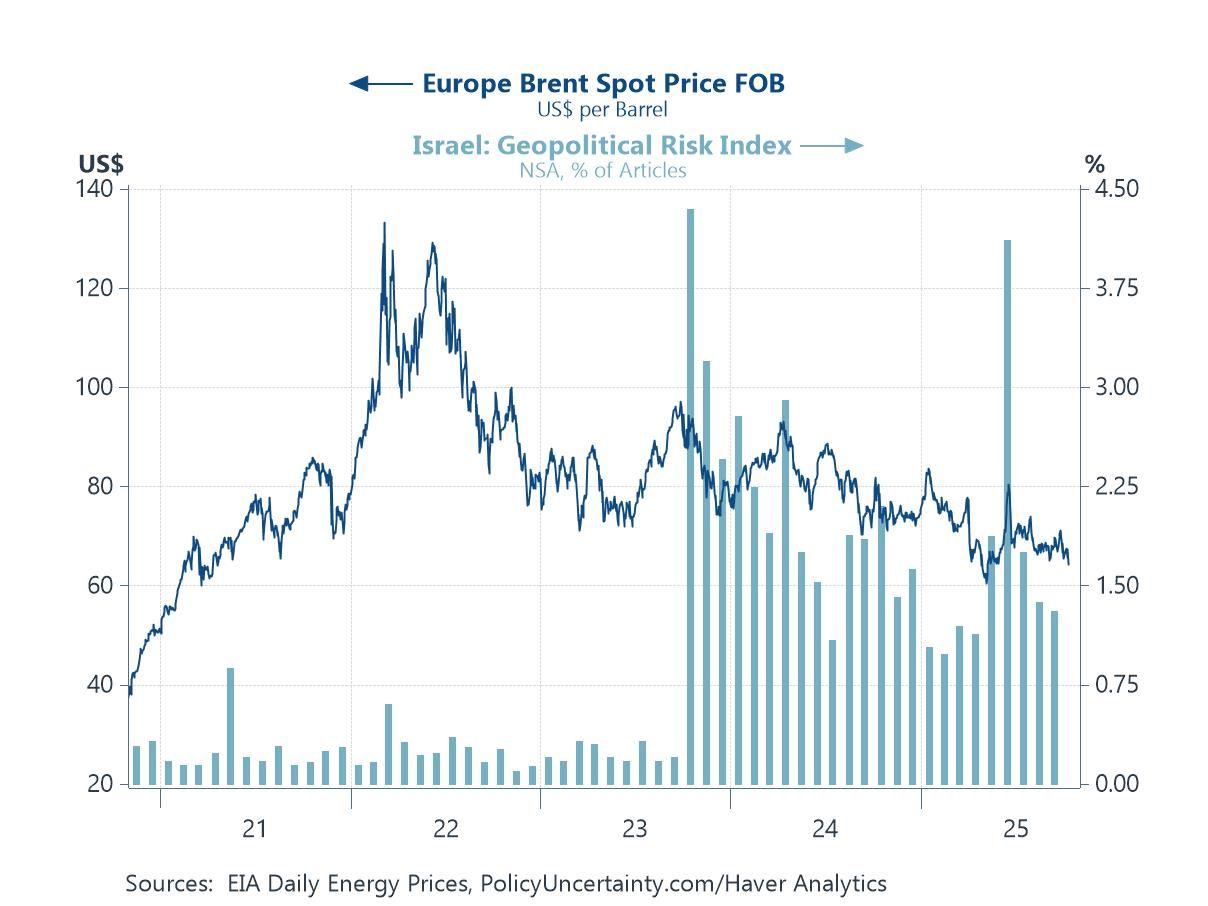
Geopolitical instability and oil prices The news this week of a peace agreement in Gaza has delivered a clear geopolitical and economic signal. As the chart shows, and before the announcement this week, a Geopolitical Risk Index for Israel (bars) has fallen sharply from its recent highs, coinciding with a notable softening in Brent crude prices (line) after months of elevated volatility. The further de-escalation in the region removes a major tail risk that had kept a premium in energy markets over much of the past year.
Chart 4: Brent Crude Oil Price Versus Geopolitical Risk in Israel
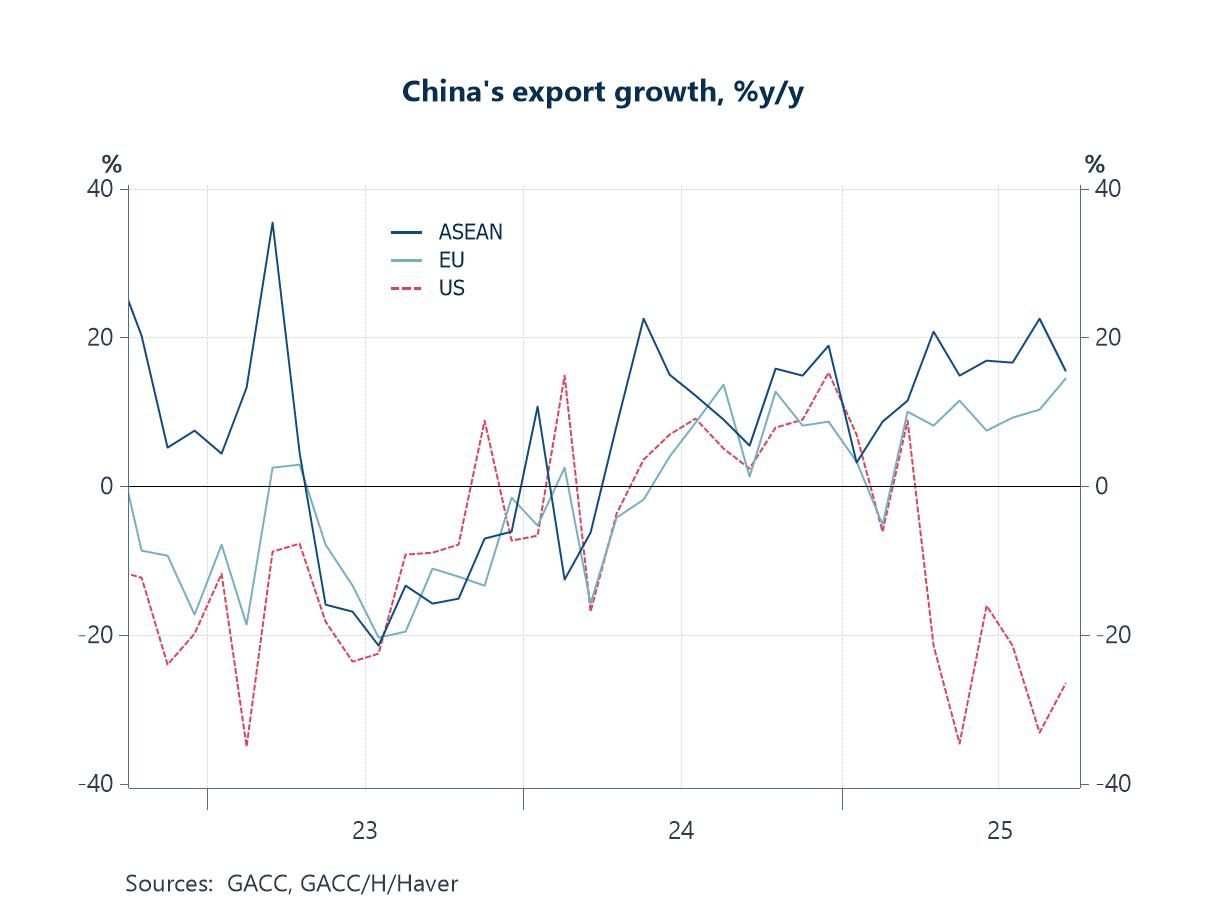
China’s trade China’s latest trade release this week surprised to the upside, but the regional mix matters. The chart shows the story: exports to ASEAN and the EU have pushed firmly back into positive double-digits this year, tracking the tech/semiconductor upcycle and demand tied to electronics, batteries and intermediate machinery. By contrast, growth of shipments to the US remain deeply negative on a year-ago basis, reflecting tariff headwinds, export controls and some demand diversion through third markets. In short, the headline beat masks a widening geographic split—Asia and parts of Europe are doing the heavy lifting, while the US lane stays a drag—underscoring how the tech cycle is lifting China’s regional partners even as policy frictions keep trans-Pacific trade subdued.
Chart 5: China’s export growth to the US, Europe and ASEAN
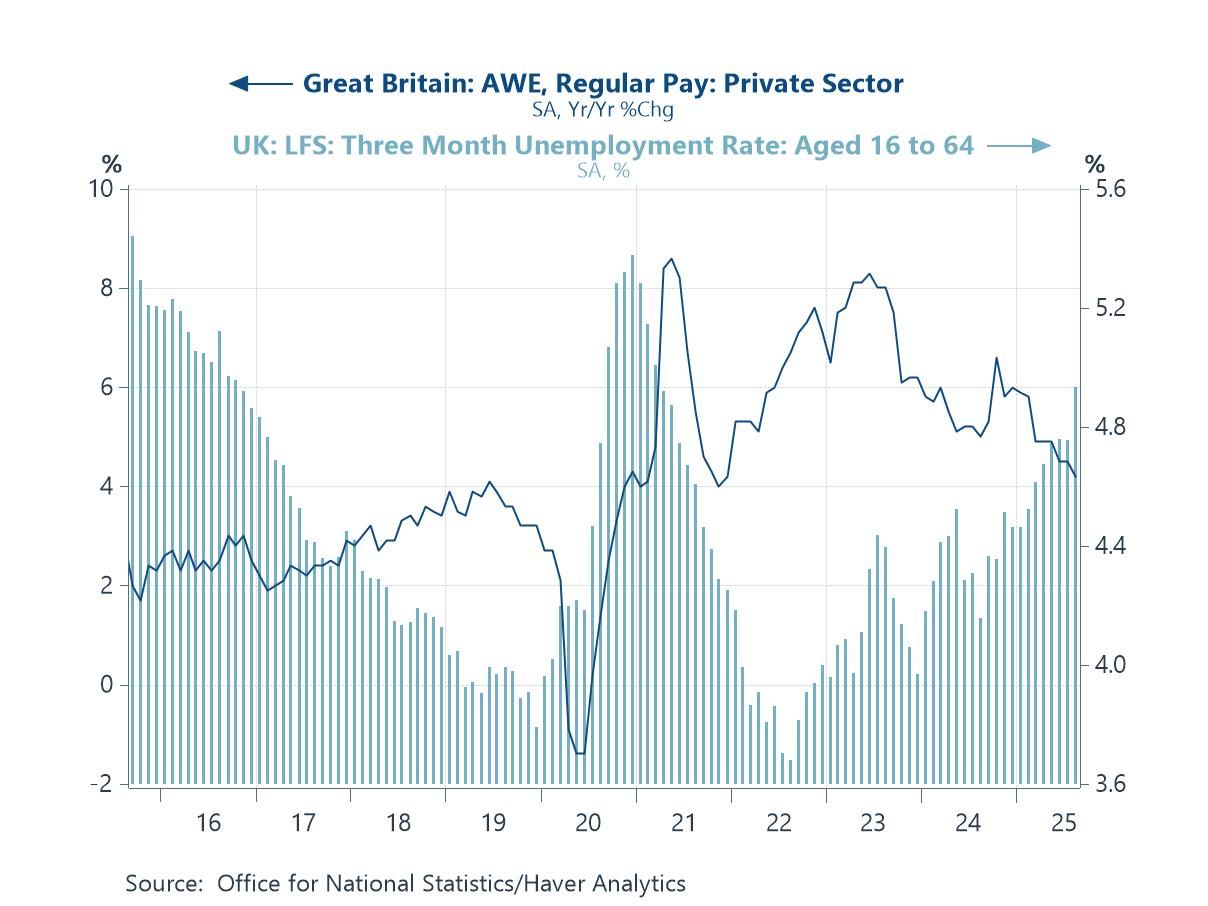
The UK economy UK labor market data, also out this week, added to the evidence of a cooling jobs market. Regular private-sector pay growth continues to trend lower from last year’s highs, while the unemployment rate has edged up and the vacancy-to-unemployed ratio has fallen back—signs that demand for labor is normalizing and bargaining power is easing. Payrolls and hours worked also look softer at the margin. Taken together, the data point to less wage-pressure risk ahead and strengthen the case for further BoE rate cuts over the next few months, provided inflation keeps tracking lower.
Chart 6: The UK labor market: The Unemployment Rate Versus Private Sector Pay Growth

Andrew Cates
AuthorMore in Author Profile »Andy Cates joined Haver Analytics as a Senior Economist in 2020. Andy has more than 25 years of experience forecasting the global economic outlook and in assessing the implications for policy settings and financial markets. He has held various senior positions in London in a number of Investment Banks including as Head of Developed Markets Economics at Nomura and as Chief Eurozone Economist at RBS. These followed a spell of 21 years as Senior International Economist at UBS, 5 of which were spent in Singapore. Prior to his time in financial services Andy was a UK economist at HM Treasury in London holding positions in the domestic forecasting and macroeconomic modelling units. He has a BA in Economics from the University of York and an MSc in Economics and Econometrics from the University of Southampton.
More Economy in Brief


