 Global| Aug 24 2007
Yr/Yr UK GDP Growth Holds Steady
Summary
GDP steady Y/Y up Q/Q on stronger private consumption. UK trends are more or less in tact with the release of the Q2 GDP report. Both exports and imports are sharply lower owing to a boost in both flows in Q1 2006. Quarterly trade [...]
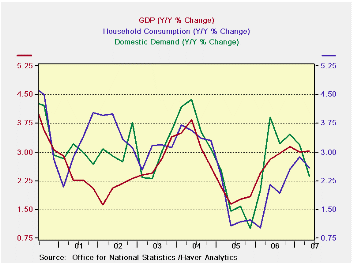
GDP steady Y/Y up Q/Q on stronger private consumption.
UK trends are more or less in tact with the release of the Q2 GDP report. Both exports and imports are sharply lower owing to a boost in both flows in Q1 2006. Quarterly trade flows show that exports are lagging a bit more in their recovery compared to imports. Private consumption is still strong, unlike on the continent.
| Consumption | Capital Formation | 3COLSPAN | ||||||
| GDP | Private | Public | Total | Housing | Exports | Imports | Domestic Demand | |
| % change Q/Q; X-M is Q/Q change in Blns of euros | ||||||||
| Q2-07 | 3.4% | 3.0% | 3.2% | -4.3% | #N/A | -4.0% | -1.7% | 3.8% |
| Q1-07 | 2.8% | 1.9% | 2.2% | 4.5% | 16.0% | -3.3% | -2.6% | 2.8% |
| Q4-06 | 3.3% | 4.4% | 1.8% | 13.1% | -11.4% | -1.4% | -3.0% | 2.6% |
| Q3-06 | 2.8% | 1.1% | 1.3% | 8.7% | 8.4% | -38.5% | -39.8% | 0.3% |
| % change Yr/Yr; X-M is Yr/Yr change in Gap in Blns of euros | ||||||||
| Q2-07 | 3.0% | 2.6% | 2.1% | 5.3% | #N/A | -13.4% | -13.5% | 2.4% |
| Q1-07 | 3.0% | 2.9% | 1.1% | 8.9% | 6.7% | -11.6% | -9.8% | 3.2% |
| Q4-06 | 3.1% | 2.5% | 1.9% | 9.8% | 5.0% | -1.1% | 0.1% | 3.5% |
| Q3-06 | 3.0% | 1.9% | 1.9% | 7.8% | 12.6% | 3.5% | 4.0% | 3.2% |
| 5-Yrs | 2.8% | 2.5% | 2.7% | 4.3% | #N/A | 3.1% | 3.6% | 2.9% |
by Robert Brusca August 24, 2007
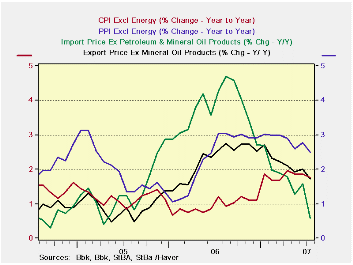
Longer view shows price pressures dissipating in Germany.
On the month, German export and import prices were subdued but over three months some pressures are evident. But broader year-over-year trends do seem to have turned a corner. Excluding petroleum export and import prices are moving lower: fast for imports, slower for exports. Domestically, producer prices excluding energy are ever so gradually losing momentum, while consumer prices are slow in showing declines after having stepped up their pace sharply early in 2007. Internationally, excluding petroleum, trends are generally milder than their domestic counterparts.
| M/M % Change | % SAAR | ||||||
| SA | Jul-07 | Jun-07 | May-07 | 3-Mo | 6-Mo | 12-Mo | Yr-Ago |
| Export Prices | -0.1% | 0.3% | 0.3% | 1.9% | 1.5% | 1.6% | 2.6% |
| Import Prices | 0.1% | 1.1% | 0.5% | 6.9% | 5.6% | 0.4% | 6.2% |
| NSA | |||||||
| Exports ex Petrol | 0.1% | 0.1% | 0.1% | 1.1% | 1.5% | 1.7% | 2.5% |
| Imports ex Petrol | -0.4% | 0.0% | 0.0% | -1.5% | 0.0% | 0.6% | 4.3% |
| Memo: SA | |||||||
| CPI | 0.3% | 0.0% | 0.2% | 1.8% | 2.5% | 1.8% | 2.0% |
| CPI ex energy | 0.2% | 0.0% | 0.1% | 1.1% | 1.5% | 1.8% | 1.2% |
| PPI | -0.1% | 0.3% | 0.3% | 2.0% | 1.9% | 1.1% | 6.0% |
| PPI ex energy | 0.1% | 0.4% | 0.2% | 2.6% | 2.6% | 2.5% | 3.0% |
by Carol Stone August 24, 2007
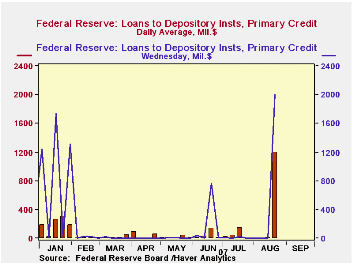
A further clarification on the borrowings data reported late yesterday by the Federal Reserve. There's some confusion over whether any banks borrowed earlier in the week or if it was just the four large banks who announced they were borrowing on Wednesday.
The Fed's "Factors Affecting Bank Reserves" H.4.1 release includes two measures for these factors, the daily average for the 7-day week ended each Wednesday and the amount outstanding on Wednesday at the close of business. The average amount of "Primary Credit" for the entire week ended August 22 was $1,200 million. The amount outstanding Wednesday night was $2,001 million. The Fed doesn't publish these figures for each day. We can, though, use the ones we have to address the general question, was there borrowing before Wednesday?
Take the $1,200 million average for the week. Multiply by 7 to obtain the aggregate amount of daily borrowing for the whole week; this is $8,400 million. Subtract the amount outstanding Wednesday night, $2,001 million, leaving $6,399 million. Divide this by the remaining days of the week, 6, and see that there indeed was an average $1,067 million every day before Wednesday. This is a not inconsiderable amount, given that there had been only $11 million of primary credit on average during the week before. We have no idea what days saw the most, who those borrowers might have been or even what Fed district they are in. But there was in fact noticeable borrowing prior to Wednesday and it looks to us that it was large enough that it probably came from a number of institutions.
U.S. Durable Goods Orders Better Due To Transportationby Tom Moeller August 24, 2007
New orders for durable goods during July gained an impressive 5.9% and the gain during the prior month was revised up slightly to 1.9%. Consensus expectations had been for a 2.0% rise in orders for last month.
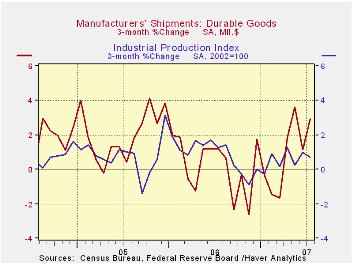
During the last ten years there has been a 67% correlation between the y/y change in durable goods orders and the change in production of durable goods.
The rise in new orders less the transportation category for July, however, was a less impressive 1.3% ... less impressive especially since it followed a 2.5% flop in June.
Changing new orders for motor vehicles & parts caused much of this volatility with a 9.8% rise last month after a 0.7% decline during June. And the aircraft sector got into the act with a 13.0% rise last month which was roughly a third of the 31.4% spike during June. 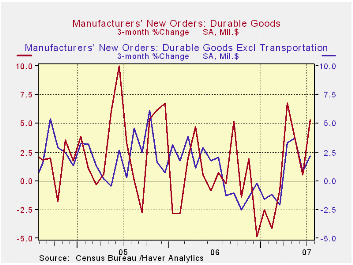
Orders for nondefense capital goods rose 5.8% during July following the 6.4% June increase which was revised up slightly. (Orders in May fell 6.8%.) Still, excluding aircraft & parts July orders rose a modest 2.2% following two months of decline The y/y change is roughly zero. During the last ten years there has been an 84% correlation between the y/y change in capital goods orders less aircraft and the y/y change in business fixed investment in equipment & software from the GDP accounts.
Orders for computers & electronic products also have been volatile. They rose 7.4% (+1.8% y/y) after a little revised 2.8% June decline. Orders for just computers & related products fell 4.0% (-8.4% y/y) for the second month of sharp decline. Primary metals orders rose 7.9% (-0.5% y/y) but that only lifted orders back about to where they were in March. And electrical equipment orders fell for the third consecutive month (+0.2% y/y). Machinery orders were the strongest area with a 5.5% (4.4% y/y) increase following a 3.4% June gain.
Shipments of durable goods rose 3.8% (4.2% y/y) after a 1.1% June slip. Less the transportation sector, shipments made up declines during the prior two months with a 1.9% (1.3% y/y) increase. During the last ten years there has been an 82% correlation between the y/y change in durable goods shipments and the change in industrial production of durable goods. The July increase less transportation amounted to 1.9% (1.3% y/y).
| NAICS Classification | July | June | Y/Y | 2006 | 2005 | 2004 |
|---|---|---|---|---|---|---|
| Durable Goods Orders | 5.9% | 1.9% | 8.1% | 6.3% | 9.9% | 5.3% |
| Excluding Transportation | 1.3% | -2.5% | 1.3% | 7.6% | 8.8% | 7.9% |
| Nondefense Capital Goods | 5.8% | 6.4% | 14.2% | 10.6% | 17.1% | 5.7% |
| Excluding Aircraft | 2.2% | -0.1% | 0.2% | 8.5% | 11.1% | 3.2% |
by Tom Moeller August 24, 2007
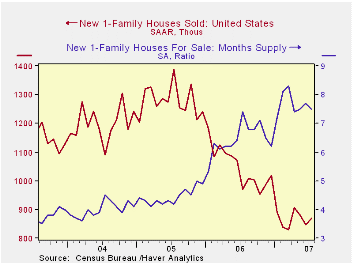
July new home sales increased 2.8% from June to 870,000 following a 4.0% drop during June which was less than reported initially.
The sales increase during July owed mostly to a 22.4% (-19.6% y/y) gain in sales in the West. Sales also rose 0.6% (-3.0% y/y) in the South but in the Northeast sales fell 24.3% (11.7 y/y) after a similar drop during June. In the Midwest sales fell 0.9% (-18.2% y/y) after a whopping 21.5% decline during June.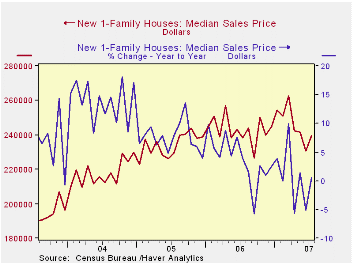
The inventory of unsold homes fell 0.9% (-7.0% y/y) after three months of steady decline.
The median new home price rose 3.9% (+0.6% y/y) after three months of hard decline during which the June decline was deepened to -4.6% m/m.
| US New Homes | July | June | Y/Y | 2006 | 2005 | 2004 |
|---|---|---|---|---|---|---|
| Total Sales (SAAR, 000s) | 870 | 846 | -10.2% | 1,049 | 1,279 | 1,201 |
| Median Price (NSA, $) | 239,500 | 230,600 | 0.6% | 241,125 | 234,208 | 217,817 |

Robert Brusca
AuthorMore in Author Profile »Robert A. Brusca is Chief Economist of Fact and Opinion Economics, a consulting firm he founded in Manhattan. He has been an economist on Wall Street for over 25 years. He has visited central banking and large institutional clients in over 30 countries in his career as an economist. Mr. Brusca was a Divisional Research Chief at the Federal Reserve Bank of NY (Chief of the International Financial markets Division), a Fed Watcher at Irving Trust and Chief Economist at Nikko Securities International. He is widely quoted and appears in various media. Mr. Brusca holds an MA and Ph.D. in economics from Michigan State University and a BA in Economics from the University of Michigan. His research pursues his strong interests in non aligned policy economics as well as international economics. FAO Economics’ research targets investors to assist them in making better investment decisions in stocks, bonds and in a variety of international assets. The company does not manage money and has no conflicts in giving economic advice.
More Economy in Brief


