 Global| Dec 09 2009
Weekly Gasoline Prices SlideSideways
by:Tom Moeller
|in:Economy in Brief
Summary
Gasoline prices haven't moved much during the last four weeks. The pump price for regular gasoline of $2.63 per gallon last week was down two cents from the November average but remained in the tight range between $2.47 and $2.69 [...]
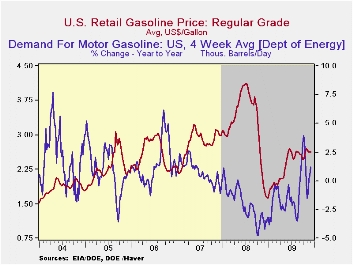 Gasoline
prices haven't moved much during the last four weeks. The pump
price for regular gasoline of $2.63 per gallon last week was
down two cents from the November average but remained in the tight
range between $2.47 and $2.69 since June. Nevertheless, gasoline prices
remain up from the December low of $1.61. Yesterday, wholesale gasoline
prices remained down slightly from last week's average. The figures are
reported by the U.S. Department of Energy and can be found in Haver's WEEKLY
& DAILY databases.
Gasoline
prices haven't moved much during the last four weeks. The pump
price for regular gasoline of $2.63 per gallon last week was
down two cents from the November average but remained in the tight
range between $2.47 and $2.69 since June. Nevertheless, gasoline prices
remain up from the December low of $1.61. Yesterday, wholesale gasoline
prices remained down slightly from last week's average. The figures are
reported by the U.S. Department of Energy and can be found in Haver's WEEKLY
& DAILY databases.
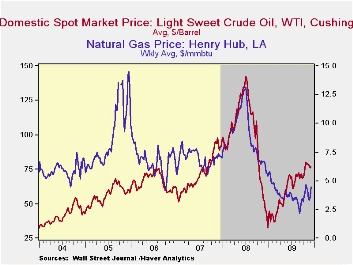 The price
for a barrel of light
sweet crude (WTI) oil rose slightly last week to $76.84 but that still
was near the lowest level since mid-October. Prices remained up from
the December low of $32.37. Yesterday, the spot market price for light
sweet crude oil fell to $72.62 per barrel.
The price
for a barrel of light
sweet crude (WTI) oil rose slightly last week to $76.84 but that still
was near the lowest level since mid-October. Prices remained up from
the December low of $32.37. Yesterday, the spot market price for light
sweet crude oil fell to $72.62 per barrel.
Natural gas prices moved higher last week to an average $4.50 per mmbtu (-30.2% y/y), the highest level since late-October. Nevertheless, they remained down by two-thirds from the high reached in early-July of last year of $13.19/mmbtu.
Last week, the demand for gasoline posted a 0.4% increase versus one year ago, down from the 3.9% increase at the beginning of last month. Breaking away from earlier y/y strength, the demand for residual fuel oil fell 22.0% y/y while distillate demand also fell by 9.9% y/y. These demand figures are in OILWKLY.
| Weekly Prices | 12/07/09 | 11/30/09 | 11/23/09 | Y/Y | 2008 | 2007 | 2006 |
|---|---|---|---|---|---|---|---|
| Retail Regular Gasoline ($ per Gallon, Regular) | 2.63 | 2.63 | 2.64 | 55.0% | 3.25 | 2.80 | 2.57 |
| Light Sweet Crude Oil, WTI ($ per bbl.) | 76.84 | 76.10 | 78.36 | 68.9% | 100.16 | 72.25 | 66.12 |
by Tom Moeller December 09, 2009
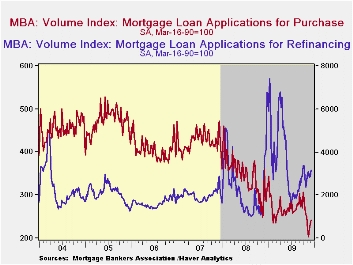 Low
interest
rates continue to support the housing market. The Mortgage Bankers
Association reported that mortgage applications rose 8.5% last week,
the second week of firm gain that continued what has been a 50% rise
since the late-June low.
Low
interest
rates continue to support the housing market. The Mortgage Bankers
Association reported that mortgage applications rose 8.5% last week,
the second week of firm gain that continued what has been a 50% rise
since the late-June low.
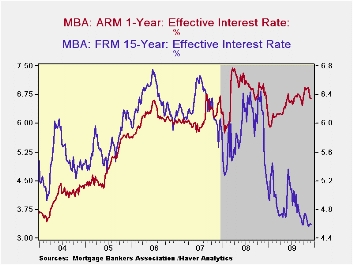
 The
effective fixed
interest rate on conventional 15-year mortgages fell slightly last week
to 4.59%. That equaled the November low and was down from the June
average of 5.21%. For 30-year mortgages the rate ticked up last week to
5.12% from a November average of 5.06%. Rates reached a high
of 5.79% in early-June. Interest rates on fixed 15-year and 30-year
mortgages are closely correlated (near-90%) with the rate on 10-year
Treasury securities. Rates on adjustable one-year mortgages fell to
6.64% last week from a November average of 6.81%.
The
effective fixed
interest rate on conventional 15-year mortgages fell slightly last week
to 4.59%. That equaled the November low and was down from the June
average of 5.21%. For 30-year mortgages the rate ticked up last week to
5.12% from a November average of 5.06%. Rates reached a high
of 5.79% in early-June. Interest rates on fixed 15-year and 30-year
mortgages are closely correlated (near-90%) with the rate on 10-year
Treasury securities. Rates on adjustable one-year mortgages fell to
6.64% last week from a November average of 6.81%.
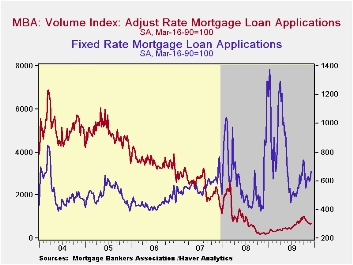
 During the
last twelve months, the number of fixed-rate mortgage applications has
fallen by 21.5% and adjustable-rate mortgage applications have risen by
two and one-half times.
During the
last twelve months, the number of fixed-rate mortgage applications has
fallen by 21.5% and adjustable-rate mortgage applications have risen by
two and one-half times.
| MBA Mortgage Applications (SA, 3/16/90=100) | 12/04/09 | 11/27/09 | Y/Y | 2008 | 2007 | 2006 |
|---|---|---|---|---|---|---|
| Total Market Index | 665.6 | 613.7 | -18.6% | 642.9 | 652.6 | 584.2 |
| Purchase | 241.5 | 232.3 | -19.4 | 345.4 | 424.9 | 406.9 |
| Refinancing | 3,185.9 | 2,866.4 | -18.4 | 2,394.1 | 1,997.9 | 1,634.0 |
| 15-Year Mortgage Effective Interest Rate (%) | 4.59% | 4.60% | 5.24% (12/08) | 5.9% | 6.2% | 6.3% |
by Robert Brusca December 9, 2009
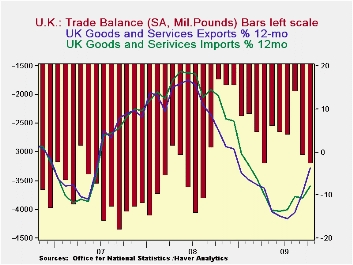
Despite faster export than import growth in October, the UK trade deficit widened in October as the larger sterling size of imports translated a smaller percentage gain in imports into a larger gain in sterling terms than for exports. The UK trade position has deteriorated for two months in a row following a brief drop in the deficit three months ago.
But in terms of trends, exports and imports are on substantially the same sort of trends using growth rates over three months, six-months and 12-mponths as benchmarks (see table). Yr/Yr trends peg exports as just a bit stronger (see chart).
Various incentive programs across Europe have given a sharp prod to exports and imports of vehicles in the UK. Three-month annualized growth rates are over 120% for both exports and imports of vehicles. Rising oil prices have boosted the value of basic materials. Foods and capital goods values are rising strongly for both exports and imports.
The strength in imports bodes well for the belief that UK domestic demand is recovering. Some of the improvement is on special factors such as rising oil prices or a reaction to vehicle sales incentives. But the strength in capital goods and in foods, feeds, beverages and tobacco seems to be an authentic signal. It is present in both UK exports and in imports. This tends to affirm the notion that both the UK and its export markets are in recovery. German exports were reported stronger today as well. In the German case, import values fell. Germany’s domestic demand is a well-known sore spot of weakness in EMU. Still the German export rise is a somewhat reassuring figure after seeing weakness in German IP and in industrial orders especially for foreign orders that were tilted to weakness for EMU members.
Obviously there still are some mixed signals out there. But for now the actual export data are still hitting a positive note. We continue to recommend looking at all signals for evidence of ongoing growth. The global economy has had a nice strong lift from its weakest levels. But the run of growth needs to continue to pull the global economy into a real sustainable expansion. As of this moment the evidence is still too mixed to be reliable.
UK Trade trends for goods| M/M% | % Saar | |||||||
| Oct-09 | Sep-09 | 3M | 6M | 12M | ||||
| Balance* | -£ 7.11 | -£ 6.94 | -£ 6.74 | -£ 6.59 | -£ 6.86 | |||
| Exports | ||||||||
| All Exp | 4.7% | 4.4% | 36.8% | 19.7% | -3.2% | |||
| Capital gds | 6.6% | 8.0% | 48.1% | 12.8% | -7.0% | |||
| Road Vehicles | 19.5% | 2.0% | 123.6% | 164.8% | 8.0% | |||
| Basic Materials | 7.5% | 16.3% | 171.2% | 20.9% | 3.3% | |||
| Food Feed Bev & Tbco | 0.9% | 3.5% | 36.1% | 6.0% | 7.4% | |||
| IMPORTS | ||||||||
| All IMP | 4.1% | 6.4% | 37.1% | 15.0% | -3.5% | |||
| Capital gds | 4.6% | 0.5% | 26.1% | 3.0% | -5.3% | |||
| Road Vehicles | 4.0% | 16.7% | 123.0% | 129.7% | 10.4% | |||
| Basic Materials | -8.3% | 28.3% | 59.1% | 11.0% | -20.0% | |||
| Food Feed Bev & Tbco | 5.9% | 0.2% | 33.1% | -0.4% | 5.3% | |||
| *Stg Blns; mo or period average | ||||||||
by Tom Moeller December 09, 2009
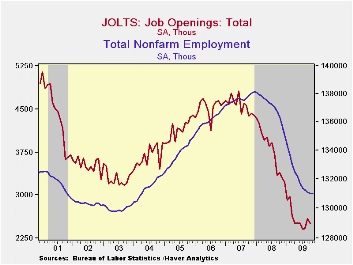 The labor
market remains soft. The Bureau of Labor Statistics reported
in its Job Openings & Labor Turnover Survey (JOLTS) that job
availability during October gave back half of the September increase
with a 3.1% decline. Openings were off 26.1% from October of last year.
The series dates back to December 2000.
The labor
market remains soft. The Bureau of Labor Statistics reported
in its Job Openings & Labor Turnover Survey (JOLTS) that job
availability during October gave back half of the September increase
with a 3.1% decline. Openings were off 26.1% from October of last year.
The series dates back to December 2000.
The job openings rate held steady m/m at 1.9%. These rates were down from more than 3.0% in 2007. The job openings rate is the number of job openings on the last business day of the month as a percent of total employment plus job openings.
Factory
sector job openings rose for the third consecutive month but they remained down 41.3% y/y. Construction
sector job openings gave back all of their September increase and were
down 27.8% y/y. Nevertheless, openings here were nearly double the
series low reached in April. The
level of professional & business services job openings gave
back half of the September increase (-23.1% y/y) while education
& health sector job openings (-17.6% y/y) also reversed half
the prior month's gain. Openings in retail trade rose slightly m/m
(-24.2% y/y) and remained up sharply from the April low while
government sector job openings rose m/m from slightly from the series
low (-23.4% y/y).
The JOLTS survey dates only to December 2000 but has
followed the movement in nonfarm payrolls, though the actual
correlation between the two series is low. A description of the Jolts
survey and the latest release from the U.S. Department of Labor is
available here
. and the figures are available in Haver's USECON
database. 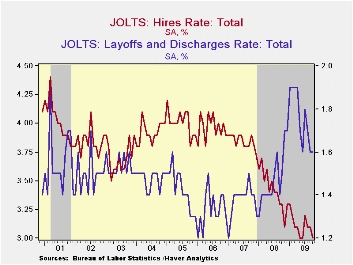 The hires
rate
dipped m/m to 3.0% and returned to the series record low. The
hires rate is the number of hires during the month divided by
employment. The actual number of hires also fell
2.3% m/m and was down 11.6% year-to-year. Factory sector hiring
recently gave back most of its September increase and was off 13.4% y/y
while construction sector hiring also dipped m/m (-10.0% y/y). Leisure
& hospitality industry jobs fell 1.3% to a new series low
(-16.0% y/y) and retail sector hiring (-15.5% y/y) remained quite weak.
In the professional & business services industry, hires fell
2.1% (-10.0% y/y) after three months of increase. In the education
& health services industries, past jobs figures were revised
sharply and in October they fell moderately, down 5.9% y/y.
The hires
rate
dipped m/m to 3.0% and returned to the series record low. The
hires rate is the number of hires during the month divided by
employment. The actual number of hires also fell
2.3% m/m and was down 11.6% year-to-year. Factory sector hiring
recently gave back most of its September increase and was off 13.4% y/y
while construction sector hiring also dipped m/m (-10.0% y/y). Leisure
& hospitality industry jobs fell 1.3% to a new series low
(-16.0% y/y) and retail sector hiring (-15.5% y/y) remained quite weak.
In the professional & business services industry, hires fell
2.1% (-10.0% y/y) after three months of increase. In the education
& health services industries, past jobs figures were revised
sharply and in October they fell moderately, down 5.9% y/y.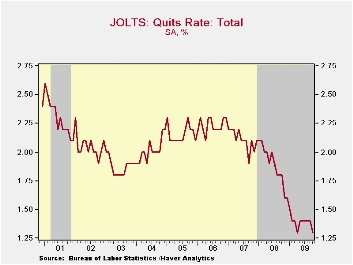 The job
separations rate fell to a new series low of 3.2% with the
actual number of separations off 14.4% year-to-year.
Separations include quits, layoffs, discharges, and other separations
as well as retirements. Layoffs and discharges alone dipped
0.3% (+0.5% y/y) during October but are down 17.4% from the
January peak.
The job
separations rate fell to a new series low of 3.2% with the
actual number of separations off 14.4% year-to-year.
Separations include quits, layoffs, discharges, and other separations
as well as retirements. Layoffs and discharges alone dipped
0.3% (+0.5% y/y) during October but are down 17.4% from the
January peak.
| JOLTS (Job Openings & Labor Turnover Survey) | October | September | August | Oct. '08 | 2008 | 2007 | 2006 |
|---|---|---|---|---|---|---|---|
| Job Openings, Total | |||||||
| Rate (%) | 1.9 | 1.9 | 1.8 | 2.4 | 2.3 | 3.1 | 3.3 |
| Total (000s) | 2,506 | 2,586 | 2,423 | 3,390 | 3,224 | 4,382 | 4,606 |
| Hires, Total | |||||||
| Rate (%) | 3.0 | 3.1 | 3.1 | 3.3 | 41.1 | 46.1 | 47.6 |
| Total (000s) | 3,966 | 4,061 | 4,040 | 4,486 | 56,486 | 63,666 | 64,879 |

Tom Moeller
AuthorMore in Author Profile »Prior to joining Haver Analytics in 2000, Mr. Moeller worked as the Economist at Chancellor Capital Management from 1985 to 1999. There, he developed comprehensive economic forecasts and interpreted economic data for equity and fixed income portfolio managers. Also at Chancellor, Mr. Moeller worked as an equity analyst and was responsible for researching and rating companies in the economically sensitive automobile and housing industries for investment in Chancellor’s equity portfolio. Prior to joining Chancellor, Mr. Moeller was an Economist at Citibank from 1979 to 1984. He also analyzed pricing behavior in the metals industry for the Council on Wage and Price Stability in Washington, D.C. In 1999, Mr. Moeller received the award for most accurate forecast from the Forecasters' Club of New York. From 1990 to 1992 he was President of the New York Association for Business Economists. Mr. Moeller earned an M.B.A. in Finance from Fordham University, where he graduated in 1987. He holds a Bachelor of Arts in Economics from George Washington University.
More Economy in Brief


