 Global| May 24 2005
Weekly Chain Store Sales Slipped Again
by:Tom Moeller
|in:Economy in Brief
Summary
Chain store sales slipped for the second week according to the International Council of Shopping Centers (ICSC)-UBS survey. A 0.2% decline last week followed the 1.0% drop during the prior period. Sales so far in May remained 0.6% [...]
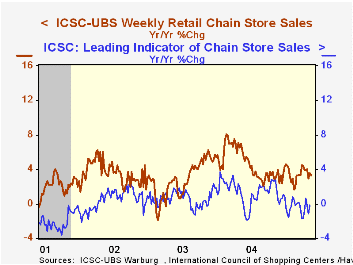
Chain store sales slipped for the second week according to the International Council of Shopping Centers (ICSC)-UBS survey. A 0.2% decline last week followed the 1.0% drop during the prior period. Sales so far in May remained 0.6% above April when sales rose 0.6% versus March.
During the last ten years there has been a 56% correlation between the y/y change in chain store sales and the change in non-auto retail sales less gasoline, as published by the US Census Department. Chain store sales correspond directly with roughly 14% of non-auto retail sales less gasoline.
The leading indicator of chain store sales from ICSC was unchanged w/w (0.1% y/y) and is up 0.4% in May versus April.
The ICSC-UBS retail chain-store sales index is constructed using the same-store sales (stores open for one year) reported by 78 stores of seven retailers: Dayton Hudson, Federated, Kmart, May, J.C. Penney, Sears and Wal-Mart.
| ICSC-UBS (SA, 1977=100) | 05/21/05 | 05/14/05 | Y/Y | 2004 | 2003 | 2002 |
|---|---|---|---|---|---|---|
| Total Weekly Chain Store Sales | 455.9 | 456.7 | 3.7% | 4.6% | 2.9% | 3.6% |
by Tom Moeller May 24, 2005

The National Association of Realtors reported that sales of existing homes jumped to another record high last month, up 4.5% at 7.180M versus Consensus expectations for sales of 6.90M. Sales during March were revised slightly lower.
Improved methodology, better modeling and the addition of condo & co-op sales affected the figures back to 1999. The data reflect closings of home sales in earlier months.Sales of single-family homes also increased to a new record high. The 4.5% m/m gain to 6.280M pulled sales so far this year to 6.055M, up 2.4% versus 2004.
Existing home sales rose m/m across the country's regions except out West where sales were unchanged m/m (2.5% y/y). Sales in the South jumped 7.0% (8.3% y/y) higher and in the Midwest sales rose 5.8% (3.8% y/y). In the Northeast sales improved 4.3% (7.1% y/y).
The median price of an existing single family home surged further to $203,800 (15.1% y/y).
The latest release from the National Association of Realtors is available here.
Can Monetary Policy Influence Long Term Interest Rates? from the Federal Reserve Bank of San Francisco is available here.
| Existing Home Sales (000, AR) | April | March | Y/Y | 2004 | 2003 | 2002 |
|---|---|---|---|---|---|---|
| Total Home Sales | 7,180 | 6,870 | 5.7% | 6,723 | 6,170 | 5,653 |
| Single Family Home Sales | 6,280 | 6,010 | 5.0% | 5,913 | 5,441 | 4,995 |
by Louise Curley May 24, 2005
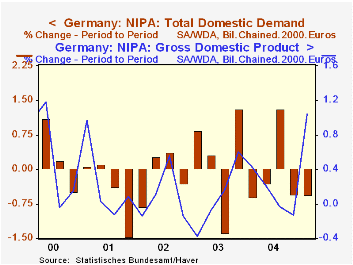
Details of Germany's first quarter Gross Domestic Product were released today. Total growth in the economy was 1%, the same as the Flash Estimate of two weeks ago. The detailed data show that domestic demand continued to be weak. It declined 0.56% in the first quarter after a similar decline in the fourth quarter of 2004. Consumption declined by 0.18% but gross investment, including inventories and the acquisition less disposal of valuables, declined 2.32%. Fixed investment, alone, was down 1.66% suggesting substantial inventory liquidation.
Exports continued to increase--2.90%--and with a decline--1.36%--in imports, the strength in the foreign sector managed to overcome the weakness in the domestic sector, resulting in the modest 1.0% gain for the whole economy. The quarter-to-quarter percent change in total GDP, along with the quarter-to-quarter change in domestic demand is shown in the first chart.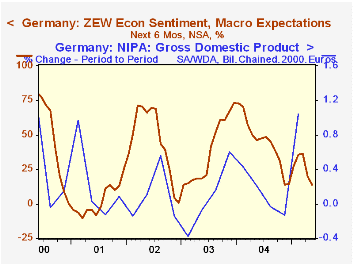
Among the institutional investors and financial analysts, who participate in the ZEW survey (also released today), the optimists are losing heart. In March of this year the percent balance between those who expected improvement in the economy over the next six months and those who expected a worsening was 36.3% That margin dropped to 20.1% in April and to 13.7% in May. The percent balance between optimists and pessimists is shown in the second chart together with the quarterly change in real GDP.
| Percent Change in German GDP and Components | Q1 05 | Q4 04 | Q3 04 | Q2 04 | Q1 04 | 2004 | 2003 | 2002 |
|---|---|---|---|---|---|---|---|---|
| Total | 1.04 | -0.14 | -1.04 | 0.20 | 0.43 | 1.04 | -0.01 | 0.20 |
| Domestic Demand | -0.56 | -0.54 | 1.31 | -0.29 | -0.61 | 0.05 | 0.73 | -1.76 |
| Consumption | -0.18 | 0.24 | 0.41 | 0.22 | -0.64 | -0.50 | -0.12 | 0.09 |
| Total Investment | -2.32 | -3.85 | 5.37 | -0.67 | -0.47 | 2.52 | 3.41 | -9.15 |
| Fixed Investment | -1.66 | 0.30 | 0.52 | 0.07 | -3.07 | -1.82 | -1.66 | -5.92 |
| Exports | 2.90 | 1.14 | -1.01 | 3.27 | 3.48 | 7.96 | 1.68 | 4.62 |
| Imports | -1.36 | 0.15 | 2.74 | 2.26 | 0.81 | 5.84 | 4.18 | -0.94 |

Tom Moeller
AuthorMore in Author Profile »Prior to joining Haver Analytics in 2000, Mr. Moeller worked as the Economist at Chancellor Capital Management from 1985 to 1999. There, he developed comprehensive economic forecasts and interpreted economic data for equity and fixed income portfolio managers. Also at Chancellor, Mr. Moeller worked as an equity analyst and was responsible for researching and rating companies in the economically sensitive automobile and housing industries for investment in Chancellor’s equity portfolio. Prior to joining Chancellor, Mr. Moeller was an Economist at Citibank from 1979 to 1984. He also analyzed pricing behavior in the metals industry for the Council on Wage and Price Stability in Washington, D.C. In 1999, Mr. Moeller received the award for most accurate forecast from the Forecasters' Club of New York. From 1990 to 1992 he was President of the New York Association for Business Economists. Mr. Moeller earned an M.B.A. in Finance from Fordham University, where he graduated in 1987. He holds a Bachelor of Arts in Economics from George Washington University.
More Economy in Brief


