 Global| Nov 19 2002
Weekly Chain Store Sales Falter
by:Tom Moeller
|in:Economy in Brief
Summary
Chain store sales fell sharply last week, according to the BTM-UBSW survey. Sales fell 1.2% and erased virtually all the gains in the prior two weeks. So far in November, sales were down 0.3% from the average sales level a month [...]

Chain store sales fell sharply last week, according to the BTM-UBSW survey. Sales fell 1.2% and erased virtually all the gains in the prior two weeks.
So far in November, sales were down 0.3% from the average sales level a month earlier. October sales fell 1.5% from September.
The October decline in chain store sales was not mirrored by declines in the BLS figures on general merchandise store sales (+1.1%) or apparel store sales (+4.0%).
During the last ten years there has been a 38% correlation between the year-to-year percent change in monthly chain store sales and the change in nonauto retail sales.
| BTM-UBSW (SA, 1977=100) | 11/16/02 | 11/09/02 | Y/Y | 2001 | 2000 | 1999 |
|---|---|---|---|---|---|---|
| Total Weekly Retail Chain Store Sales | 397.1 | 402.0 | 2.0% | 2.1% | 3.4% | 6.7% |
by Tom Moeller November 19, 2002

The U.S. foreign trade deficit remained deeper than expected in September following the record deficit of the month earlier. The previously reported August deficit was lessened slightly due to a lessened decline in exports. Consensus expectations had been for a September deficit of $37.2B
Exports fell for the second consecutive month. The y/y comparison improved due to a sharp 7.3% m/m decline in exports last September. Capital goods exports rose a moderate 0.8% (9.6% AR, YTD) but nonauto consumer goods exports fell for the second consecutive month (-0.5% AR, YTD).
Imports rose moderately, held back by the third consecutive monthly decline in capital goods imports. Imports of nonauto consumer goods fell 1.4% following the 5.2% August spurt.
The refiner's acquisition cost of imported crude oil rose to $26.64 in September versus $15.95 in December. Crude oil prices rose further in October but have fallen sharply in November.
| Foreign Trade | Sept | Aug | Y/Y | 2001 | 2000 | 1999 |
|---|---|---|---|---|---|---|
| Trade Deficit | $38.0B | $38.3B | $19.5B(9/01) | $358.3B | $378.7B | $262.2B |
| Exports - Goods & Services | -0.4% | -0.5% | 6.7% | -6.2% | 11.2% | 2.6% |
| Imports - Goods & Services | -0.5% | 2.4% | 24.5% | -6.0% | 18.3% | 10.9% |
by Tom Moeller November 19, 2002
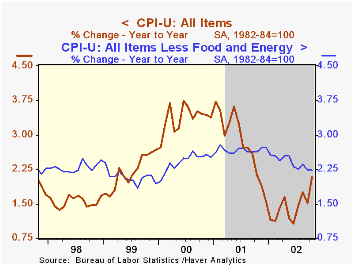
The Consumer Price Index (CPI-U) rose 0.3% last month, slightly above the YTD average of 0.2%. The gain was as expected. Excluding food and energy, prices also rose as expected, about equal to the YTD average.
Lower tobacco prices (-3.1%) helped restrain inflation last month, though the core CPI less tobacco rose the same 0.2% as the overall core due to rounding.
Amongst other goods, some prices firmed. Household furnishings and operation prices rose 0.3%, the first gain in five months. New vehicle prices rose 0.4% following a 0.5% September gain.On the downside were used car prices (-1.6%). Apparel prices were flat.
Services prices were mixed. Shelter prices rose just 0.2% following the 0.1% gain in the prior month. Public transportation prices fell 1.6% for the fourth decline in five months. Education prices were flat following a 0.2% decline the month prior. Recreation prices were up 0.3%, however, and medical care services prices surged 0.7%, nearly double the elevated September gain.
Energy prices were again strong last month led by a 3.4% (33.1% AR, YTD) rise in gasoline prices. Fuel oil prices also were strong, up 1.7%. Piped gas & electricity prices were up 0.4% for the third month.
| Consumer Price Index | Oct | Sept | Y/Y | 2001 | 2000 | 1999 |
|---|---|---|---|---|---|---|
| Total | 0.3% | 0.2% | 2.1% | 2.8% | 3.4% | 2.2% |
| Total less Food & Energy | 0.2% | 0.1% | 2.2% | 2.7% | 2.4% | 2.1% |
| Goods less Food & Energy | -0.1% | 0.0% | -1.1% | 0.3% | 0.5% | 0.7% |
| Services less Energy | 0.3% | 0.1% | 3.7% | 3.7% | 3.3% | 2.7% |
| Energy | 1.9% | 0.7% | 3.0% | 3.7% | 16.9% | 3.6% |
| Food & Beverages | 0.1% | 0.2% | 0.9% | 3.1% | 2.3% | 2.1% |
| Chained CPI: Total (NSA) | 0.2% | 0.2% | 1.7% | 2.1% | 2.0% | NA |
| Total less Food & Energy | 0.2% | 0.2% | 1.7% | 1.9% | 1.4% | NA |
by Tom Moeller November 19, 2002

The National Association of Home Builders index of new home sales rose sharply last month and during the recent several months following a period of relative stability early this year. The latest rise was to the highest level in two years.
Surveys of market conditions both currently and prospectively in the next six month improved. The current sales index improved sharply.
During the last fifteen years there has been a 70% correlation between the annual percent change in the NAHB Index and the change in new home sales.
For a description of the housing market index from the National Association of Home Builders, visit the NAHB website.
| Nat'l Association of Home Builders | Nov | Oct | Y/Y | 2001 | 2000 | 1999 |
|---|---|---|---|---|---|---|
| Composite Housing Market Index | 65 | 63 | 49 | 56 | 62 | 73 |

Tom Moeller
AuthorMore in Author Profile »Prior to joining Haver Analytics in 2000, Mr. Moeller worked as the Economist at Chancellor Capital Management from 1985 to 1999. There, he developed comprehensive economic forecasts and interpreted economic data for equity and fixed income portfolio managers. Also at Chancellor, Mr. Moeller worked as an equity analyst and was responsible for researching and rating companies in the economically sensitive automobile and housing industries for investment in Chancellor’s equity portfolio. Prior to joining Chancellor, Mr. Moeller was an Economist at Citibank from 1979 to 1984. He also analyzed pricing behavior in the metals industry for the Council on Wage and Price Stability in Washington, D.C. In 1999, Mr. Moeller received the award for most accurate forecast from the Forecasters' Club of New York. From 1990 to 1992 he was President of the New York Association for Business Economists. Mr. Moeller earned an M.B.A. in Finance from Fordham University, where he graduated in 1987. He holds a Bachelor of Arts in Economics from George Washington University.
More Economy in Brief


