 Global| Apr 29 2021
Very Sharp and Broad Jump in EU Commission Indexes for EMU
Summary
April brought a surge to the reading for all of the EMU in the European Commission’s index profile of the euro area. The index gain is the third largest month-to-month gain on data back to 2000. It is the largest month-to-month gain [...]
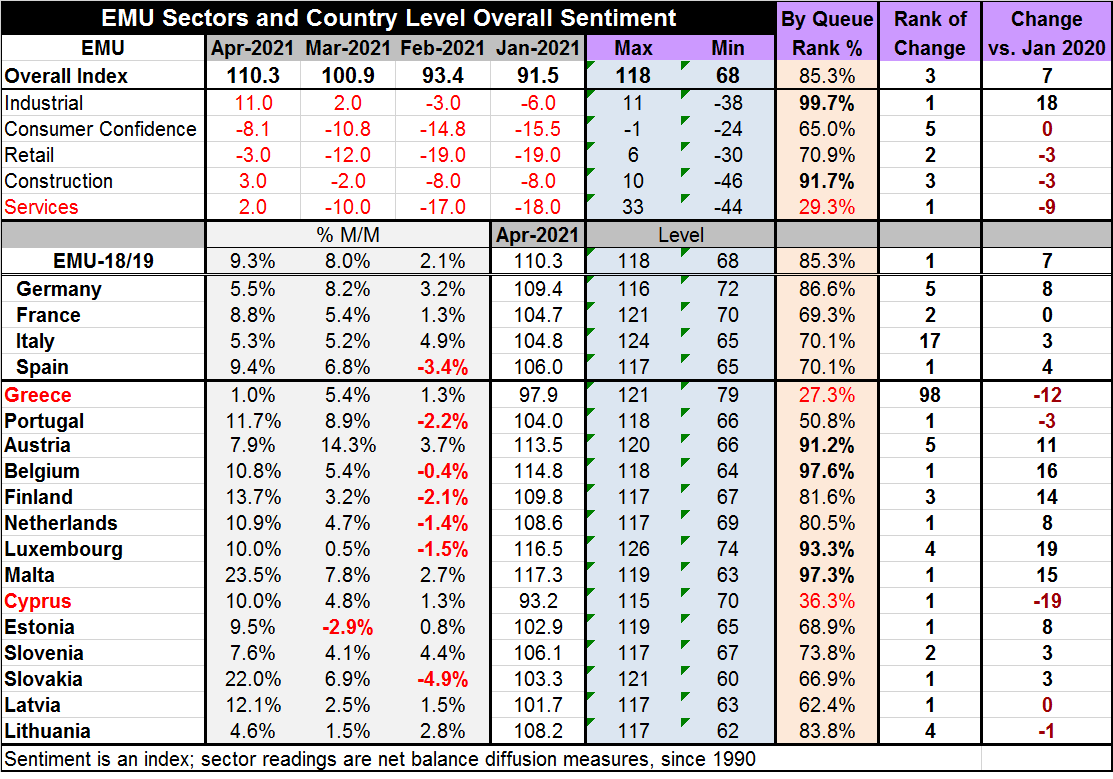
 April brought a surge to the reading for all of the EMU in the European Commission’s index profile of the euro area. The index gain is the third largest month-to-month gain on data back to 2000. It is the largest month-to-month gain for the industrial sector as well as for services on this timeline. The services diffusion reading gained 12 diffusion points (an up minus down framework) on the month which is very good news as it describes the EMU area as having an increase in output spreading strongly to the services sector as well as to the industrial sector, the latter we already knew. However, even with the jump in the service sector diffusion reading this month, the services index languishes at a 29.3 percentile standing in the lower 30th percentile of its historic queue of data.
With the ongoing problems of the services sector and lack of vaccine in Europe, there really has been no hint of the services sector showing such an improvement this month. The overall activity evaluation of the sector is still extremely weak in an historic context. But improvement is spreading and that is a very good sign.
In fact, of the five separate sector/readings, no sector has an improvement in its month-to-month change that ranks any weaker than the fifth best on record over a run of 252 observations – that is an impressive and broad set of gains in the EMU.
Sector results
This month changes boost the overall EMU reading to its 85th percentile. But that is somewhat misleading. That index is boosted by a high 99th percentile reading for the industrial sector (the sector standing is 99.7 marking the sector as ‘this high or higher’ only 0.3% of the time - this is its highest reading on this timeline). There is also a 91.7 percentile reading in construction. These are both important sectors, but they are both relatively low-employment sectors. Retail has a solid 70.9 percentile ranking. But the services sector, the real job creating sector, has only a 29.3 percentile reading. A simple, unweighted average of the sector rankings comes in at its 71st percentile.
Rankings by country
The simple average ranking of all month-to-month change for the comprehensive country sentiment indexes for April is 14.4, but that is badly distorted to the weak side by Greece’s unfortunate ranking of 98. Exclude Greece and the average ranking rises to 2.9- an extremely impressive figure. That again underscores that this improvement is across industries as well as across EMU members leaving almost no one behind. Apart from Greece’s weak ranking, Italy is the next weakest at 17, followed by Austria and Germany tied at a rank of 5. All the other monthly rankings based on monthly gains in the EU Commission index register even higher ranking results (lower rank numbers).
Since Covid-19 struck, how far has the EMU come?
A lot is being made of comparisons to the pre-Covid-19 period. Compared to January 2020, the overall EMU index is higher by 7 points. That is pretty much the result of one sector, the industrial sector, that higher by 18 points. Retail, construction and services all are net weaker on that comparison while consumer confidence is unchanged.
Country detail since Covid-19 struck
Looking at country detail, France is unchanged from its EU index value of January 2020. But the other three largest EMU economies are higher: Germany (+8), Italy (+3), and Spain (+4). That leaves 14 other reporting countries. Among them, only four are weaker than in January 2020; they are Cyprus (-19), Greece (-12), Portugal (-3), and Lithuania (-1). Latvia is unchanged on that comparison.
After all this, where does the EMU stand?
Looking more broadly at how much the queue percentile standing has risen to on the month, we find only two EMU members with queue standings below their respective medians (below 50%). They are Greece and Cyprus. This is very good news.
The healing process is well in gear. We have moved beyond the resuscitate, save, and stabilize stage. Every reporting EMU member improved month-to-month in April and every country except Estonia has improved for two months in a row. The news on changes of all sorts is extremely upbeat this month. But we must balance it against the news on the queue standings which tell us, apart from how much things have changed month-to-month, where they stand. On that score, the average country ranking is 72.9%; the median is 73.8%. The average is lower than the median because there are two countries with rankings substantially weaker than all the rest. The four largest EMU economies have an unweighted average ranking of 74%. These are percentile standings in each country’s respective queue of data since 1990.
Rankings in the mid-seventies seem to describe better where the EMU really stands. Any conglomeration ranking is determined by what the group members are weighted by…is it GDP size, wealth, population, employment and so on? For now I think the lagging behavior of the services sector suggests we should be careful to not in our mind overweight the status of the EMU because the industrial sector is doing so well. The EMU unemployment rate is still elevated even though the EMU gauge in the EU Commission scheme is above its January 2020 level. People are not yet back to work and many are still being supported by government programs as well as a very accommodative monetary policy. Fragility abounds…
Back TOWARD normal
So are we back to normal or above normal as a naive reading of the EU commission indexes might say? No! Absolutely Not! As an old expression reminds us, “statistics lie and liars use statistics.’ Which is to say that politicians will undoubtedly use some of these bits of data to try and persuade you that they have done a real bang-up job. But the job is not completed and there is still a lot left to do. If you are going to look at statistics (like we economists do), be sure you look at a lot of them and look at data from different angles. I have tried to do that above to give you a look and the various views of the changes as well as at the levels of readings and across different time frames. When we do this, we do detect improvement. And we detect improvement that is very broad-based and it’s a very good and largely unexpected development. But do not kid yourself; there is still a very long way to go. So have a celebratory drink if you are so inclined, but make it beer instead of Champaign. There is a bigger celebration that lies still well ahead.

Robert Brusca
AuthorMore in Author Profile »Robert A. Brusca is Chief Economist of Fact and Opinion Economics, a consulting firm he founded in Manhattan. He has been an economist on Wall Street for over 25 years. He has visited central banking and large institutional clients in over 30 countries in his career as an economist. Mr. Brusca was a Divisional Research Chief at the Federal Reserve Bank of NY (Chief of the International Financial markets Division), a Fed Watcher at Irving Trust and Chief Economist at Nikko Securities International. He is widely quoted and appears in various media. Mr. Brusca holds an MA and Ph.D. in economics from Michigan State University and a BA in Economics from the University of Michigan. His research pursues his strong interests in non aligned policy economics as well as international economics. FAO Economics’ research targets investors to assist them in making better investment decisions in stocks, bonds and in a variety of international assets. The company does not manage money and has no conflicts in giving economic advice.