 Global| Sep 29 2005
US GDP Growth Unrevised
by:Tom Moeller
|in:Economy in Brief
Summary
The "final" estimate of US real GDP growth during 2Q was unrevised at 3.3% (AR) and matched Consensus expectations. Downward revisions to foreign trade and inventories were offset by an upward revision to domestic demand growth. The [...]
The "final" estimate of US real GDP growth during 2Q was unrevised at 3.3% (AR) and matched Consensus expectations. Downward revisions to foreign trade and inventories were offset by an upward revision to domestic demand growth.
The upward revision to domestic demand growth stemmed from business fixed investment growth to 8.8% from 8.4% (AR, 9.2% y/y) and growth in real PCE which was raised to 3.9% from 3.0% (3.9% y/y). Residential building growth also was raised to 10.8% from 9.8% (6.1% y/y).
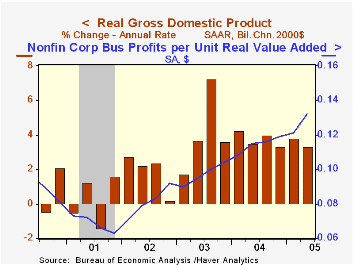
Growth in operating corporate profits was reduced to 4.6% from 6.1% (16.0%) following a 5.6% gain during 1Q. Growth in US nonfinancial corporate sector earnings was lowered slightly to 11.5% from 11.9% (23.7% y/y), still the strongest quarterly increase in three years.Profit margin expansion last quarter was the greatest on record.
The positive contribution to GDP growth from a shallower foreign trade deficit was lessened to 1.1 percentage points. Import growth was reduced back to an estimated slight q/q decline (+5.7% y/y) but growth in exports was lowered more to 10.7% from 13.2% (AR, 7.7% y/y).
The negative growth contribution from inventory decumulation was lessened slightly and still was the third in the last four quarters and was the largest since 2000.
The chain price index was revised up to 2.6% as the chain price index for domestic final demand was raised to 3.3% (2.8% y/y).
Why Has Output Become Less Volatile? from the Federal Reserve Bank of San Francisco is available here.
| Chained 2000$, % AR | 2Q '05 (Final) | 2Q '05 (Prelim.) | 1Q '05 | Y/Y | 2004 | 2003 | 2002 |
|---|---|---|---|---|---|---|---|
| GDP | 3.3% | 3.3% | 3.8% | 3.6% | 4.2% | 2.7% | 1.6% |
| Inventory Effect | -2.1% | -2.0% | 0.3% | -1.4% | 0.3% | 0.0% | 0.4% |
| Final Sales | 5.6% | 5.4% | 3.5% | 4.2% | 3.9% | 2.7% | 1.2% |
| Foreign Trade Effect | 1.1% | 1.2% | -0.4% | 0.1% | -0.5% | -0.3% | -0.6% |
| Domestic Final Demand | 4.2% | 3.9% | 3.7% | 4.1% | 4.4% | 3.0% | 1.8% |
| Chained GDP Price Index | 2.6% | 2.4% | 3.1% | 2.5% | 2.6% | 2.0% | 1.7% |

Tom Moeller
AuthorMore in Author Profile »Prior to joining Haver Analytics in 2000, Mr. Moeller worked as the Economist at Chancellor Capital Management from 1985 to 1999. There, he developed comprehensive economic forecasts and interpreted economic data for equity and fixed income portfolio managers. Also at Chancellor, Mr. Moeller worked as an equity analyst and was responsible for researching and rating companies in the economically sensitive automobile and housing industries for investment in Chancellor’s equity portfolio. Prior to joining Chancellor, Mr. Moeller was an Economist at Citibank from 1979 to 1984. He also analyzed pricing behavior in the metals industry for the Council on Wage and Price Stability in Washington, D.C. In 1999, Mr. Moeller received the award for most accurate forecast from the Forecasters' Club of New York. From 1990 to 1992 he was President of the New York Association for Business Economists. Mr. Moeller earned an M.B.A. in Finance from Fordham University, where he graduated in 1987. He holds a Bachelor of Arts in Economics from George Washington University.
More Economy in Brief


