 Global| Jul 29 2005
US GDP Growth About As Expected in 2Q
by:Tom Moeller
|in:Economy in Brief
Summary
US real GDP in 2Q '05 grew 3.4% (AR) versus the Consensus expectation for 3.5% growth. Revisions to data from 2002 to 2004 lowered growth to an average 2.8% during the period from 3.1% estimated earlier. Growth in domestic demand [...]
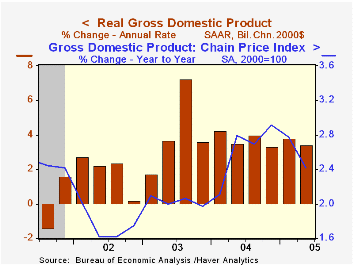
US real GDP in 2Q '05 grew 3.4% (AR) versus the Consensus expectation for 3.5% growth. Revisions to data from 2002 to 2004 lowered growth to an average 2.8% during the period from 3.1% estimated earlier.
Growth in domestic demand continued firm last quarter at a 4.0% annual rate. The acceleration versus 1Q owed to faster growth in business fixed investment at 9.0% (AR, 9.2% y/y) which occurred because of 40.8% (AR) growth in transportation. Real PCE grew 3.3% (3.9% y/y), down slightly from last year's pace, and residential building grew a solid 9.8% (5.9% y/y).
Slower production growth occurred as inventories were drawn down for the first quarter in two years and lowered GDP growth by 2.3 percentage points. It was the third subtraction from GDP growth due to inventories in the last four quarters but it was the largest subtraction since 2000.
A smaller foreign trade deficit contributed 1.6% percentage points to growth last quarter as exports surged 12.6% (8.1% y/y) and easily outpaced imports which declined across categories; by 2.0% (5.2 y/y) in total.
The chain price index grew 2.4%, the slowest rate of growth since 3Q04. The slowdown was the result of foreign trade. The chain price index for domestic final demand grew 3.2% (2.8% y/y), up from 2.9% growth last year.
Happy-Hour Economics, or How an Increase in Demand Can Produce a Decrease in Price from the Federal Reserve Bank of Atlanta can be found here.
| Chained 2000$, % AR | 2Q '05 (Advance) | 1Q '05 | Y/Y | 2004 | 2003 | 2002 |
|---|---|---|---|---|---|---|
| GDP | 3.4% | 3.8% | 3.6% | 4.2% | 2.7% | 1.6% |
| Inventory Effect | -2.3% | 0.3% | -1.3% | 0.3% | 0.0% | 0.4% |
| Final Sales | 5.8% | 3.5% | 4.3% | 3.9% | 2.7% | 1.2% |
| Foreign Trade Effect | 1.6% | -0.4% | 0.2% | -0.5% | -0.3% | -0.6% |
| Domestic Final Demand | 4.0% | 3.7% | 4.1% | 4.4% | 3.0% | 1.8% |
| Chained GDP Price Index | 2.4% | 3.1% | 2.4% | 2.6% | 2.0% | 1.7% |

Tom Moeller
AuthorMore in Author Profile »Prior to joining Haver Analytics in 2000, Mr. Moeller worked as the Economist at Chancellor Capital Management from 1985 to 1999. There, he developed comprehensive economic forecasts and interpreted economic data for equity and fixed income portfolio managers. Also at Chancellor, Mr. Moeller worked as an equity analyst and was responsible for researching and rating companies in the economically sensitive automobile and housing industries for investment in Chancellor’s equity portfolio. Prior to joining Chancellor, Mr. Moeller was an Economist at Citibank from 1979 to 1984. He also analyzed pricing behavior in the metals industry for the Council on Wage and Price Stability in Washington, D.C. In 1999, Mr. Moeller received the award for most accurate forecast from the Forecasters' Club of New York. From 1990 to 1992 he was President of the New York Association for Business Economists. Mr. Moeller earned an M.B.A. in Finance from Fordham University, where he graduated in 1987. He holds a Bachelor of Arts in Economics from George Washington University.
More Economy in Brief


