 Global| Mar 11 2005
US Exports Come from Every State; 22 Ship over $1 Billion a Month
Summary
The Census Bureau reports trade data in a number of ways, and Haver banks a good deal of them in regional databases. The REGIONAL database includes a monthly summary of exports of goods by state, which is released at the same time as [...]
The Census Bureau reports trade data in a number of ways, and Haver banks a good deal of them in regional databases. The REGIONAL database includes a monthly summary of exports of goods by state, which is released at the same time as the other detail on the monthly trade reports. Just a few hours later, data on shipments through specific ports are released for both exports and imports; Haver includes these in the PORTS database. Once a quarter an incredible amount of detail is published for exports by states by NAICS Code by country. So you can see there, for instance, the value of machinery shipped from Tennessee to Azerbaijan. These data are divided among nine databases, one for each Census Region.
Today's January trade report, as noted by Tom Moeller, saw a widening of the trade deficit for January. But even so, US exports appear to be quite strong. Shipments of goods abroad totaled $66.38 billion, not seasonally adjusted, up 12.2% from a year ago, following December's 13.5% increase. In all of last year these exports grew 12.8% from 2003.
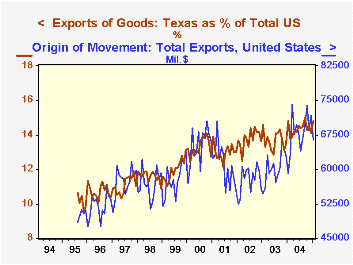
As seen in the table below, Texas is the biggest exporting state, with $9.8 billion, representing 14.8% of January's total. In the PORTS database, we see that the Houston District is, as would be expected, the largest volume point of departure; but the Laredo District is also very significant, a circumstance which would highlight the role of NAFTA relationships with Mexico and trade elsewhere in Latin America.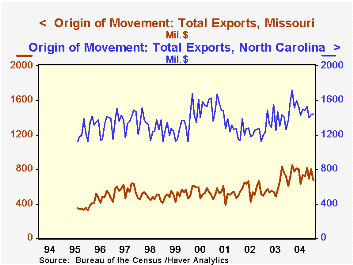
California follows close behind, shipping $8.72 billion in January. Then there is a big gap to number 3 New York, with $3.86 billion in shipments. We've included a couple of other states in our table to illustrate various magnitudes. Virtually every state exports something, although for a few, it can be well under $100 million each month. These data became important a number of years ago to illustrate the significance of sales abroad for local and regional economies. Indeed, 22 states have exports that have recently been averaging over $1 billion a month. This dataset includes, by the way, the District of Columbia, Puerto Rico and the Virgin Islands. "Origin of Movement" classifies this information according to the location where shipping began; this is more reliable than the location of the exporter, since that may not be close to the place where the goods are actually produced and shipped.
Haver's software, DLXVG3, makes comparisons among the states simple. We used the "Excel Mode" to insert codes for all 53 of these these states and locales into a spreadsheet with one quick operation, and then applied a regular DLX retrieval operation to bring the data in. Excel's sorting capabilities make it easy to rank the states.
| Exports by State Billions of $ |
10-Yr Avg | Jan 2005 | Dec 2004 | Year Ago | Monthly Average|||
|---|---|---|---|---|---|---|---|
| 2004 | 2003 | 2002 | |||||
| Total | -- | 66.38 | 71.68 | 59.16 | 68.05 | 60.31 | 57.77 |
| % Change | 3.4 | 12.2 | 13.5 | 8.1 | 12.8 | 4.4 | -5.2 |
| Texas (1) | -- | 9.82 | 10.11 | 8.75 | 9.76 | 8.24 | 7.95 |
| % Change | 8.4 | 12.3 | 19.0 | 9.9 | 18.5 | 3.6 | 0.4 |
| California (2) | -- | 8.72 | 9.75 | 7.98 | 9.16 | 7.83 | 7.68 |
| % Change | 3.7 | 9.3 | 8.0 | 16.5 | 16.9 | 1.9 | -13.6 |
| New York (3) | -- | 3.86 | 4.09 | 2.95 | 3.69 | 3.27 | 3.08 |
| % Change | 5.2 | 30.8 | 19.4 | 1.4 | 13.1 | 6.0 | -12.3 |
| North Carolina (15) | -- | 1.44 | 1.43 | 1.36 | 1.51 | 1.35 | 1.23 |
| % Change | 3.0 | 5.4 | 13.3 | 14.8 | 11.6 | 10.1 | -12.4 |
| Missouri (27) | -- | 0.69 | 0.80 | 0.61 | 0.75 | 0.60 | 0.57 |
Carol Stone, CBE
AuthorMore in Author Profile »Carol Stone, CBE came to Haver Analytics in 2003 following more than 35 years as a financial market economist at major Wall Street financial institutions, most especially Merrill Lynch and Nomura Securities. She had broad experience in analysis and forecasting of flow-of-funds accounts, the federal budget and Federal Reserve operations. At Nomura Securities, among other duties, she developed various indicator forecasting tools and edited a daily global publication produced in London and New York for readers in Tokyo. At Haver Analytics, Carol was a member of the Research Department, aiding database managers with research and documentation efforts, as well as posting commentary on select economic reports. In addition, she conducted Ways-of-the-World, a blog on economic issues for an Episcopal-Church-affiliated website, The Geranium Farm. During her career, Carol served as an officer of the Money Marketeers and the Downtown Economists Club. She had a PhD from NYU's Stern School of Business. She lived in Brooklyn, New York, and had a weekend home on Long Island.
More Economy in Brief


