 Global| Mar 23 2007
US Existing Home Sales Jump – Markets Taken by Surprise
Summary
Existing homes sales had been expected to drop in February. Instead they jumped by 3.9% and that was after a gain of 2.7% in January. Whats up? Housing starts were off sharply in January then up in February but existing home sales [...]
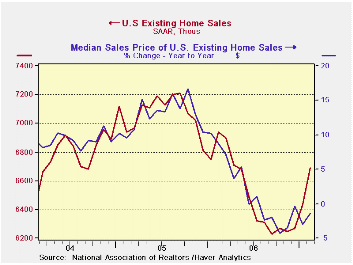
Existing homes sales had been expected to drop in February. Instead they jumped by 3.9% and that was after a gain of 2.7% in January. What’s up? Housing starts were off sharply in January then up in February but existing home sales are subject to different forces as well as some of the same dynamics. Weather was deemed to have been a factor for housing starts. Admittedly weather is more of a factor for house-building than buying. Moreover existing home sales are on a different timeline. Starts and new home sales book at the time of the transaction’s inception. Existing home sales book at the transaction’s completion. Since about 70% of the population owns homes, you probably know what this means, first hand. The lag on existing home sales depends on the length of time from the initial signing of the contract through to the closing, a period that requires appraisals, much document preparation and eventually a bank completing a credit decision and a meeting with all interested parties. So we had expected existing home sales to reveal conditions more like January than like February. WRONG!
Perhaps the larger surprise was that existing home sales were strong across the nation. Sales were flat in the West and up everywhere else on the month. Over periods of three months and six months, growth rates for existing home sales are firm to strong. Year/year, three of four national regions show sales lower but the Northeast (a region where bad weather is most likely to be a depressing factor at this time of year) oddly is up (3.4%). The Midwest is barely lower at -1.9%. The South is off by 4.4% and the West by a much larger 9.6%. (see table below).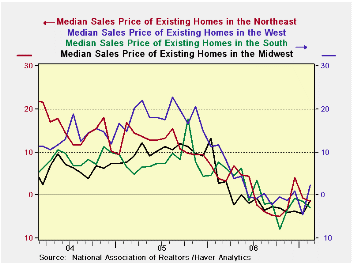
At the same time, prices have been softening. While using February as an end point probably exaggerates the trend decline in prices over the past 20 months, prices are falling at a 3.3% annualized rate for that period. But the point is that prices have been softer and lower prices have not seized up the market but rather lubricated it.
Existing home prices remain weak across regions. For housing starts and new home sales (the latter not yet available for this month) builders have a cost element and a margin they try to protect and so prices may not have so much flexibility. But with the run-up in house prices over the last 5-6 years or more, homeowners have a lot of equity, in general, and that gives them the flexibility to make deals. And if you are a seller/buyer this does not really hurt you. A seller/buyer is an existing home seller who is also looking to buy somewhere else – as most are. This sort of transactor learns quickly that what you lose on your house sale (compared to the profit you might have made when house prices were at their peak) you make up for when you buy and get a good deal on the ‘other end’. So the drop in the price for existing homes probably exaggerates the ‘pain’ being inflicted on sellers.
Different strokes for different folks…Diminishing weakness for starts and permits but outright strength for existing home sales.
 |
| · Since most existing home sellers live in their homes they often can wait out bad markets or decide to bite the bullet and take less and sell. It all depends on individual circumstances. Some houses are sold due to a death in the family and estate needs, some are due to job transfers and location shifts, others are due to pure housing preferences that change or a desire for more/less space related to the natural family cycle and some are unrequested career choices foisted on the individual by his/her former employer, and so on. This makes existing homes an irregular market or to put it another way, a market rife with conflicting opportunities. It is much different from dealing with a builder. · On balance it is difficult to figure out what these robust sales mean for the economy. Existing home sales make little contribution to GDP directly since they are just a market trading around the existing residential housing stock. But we know that house-buying usually triggers a spate of other transactions. For now we add this to the stack of reports that do not add up. And that pile is getting larger. For every weak report it seems we get a strong one. While this is not one of the key reports or even contributors to GDP it tells us something about economic activity and peoples’ motivations. They appear to be liquid and mobile and able to transact in a market we thought would be difficult and that is not what we had expected. This report makes the economy seem more resilient, if not strong. |
|---|
| Mo/Mo% | Total | North-East | Mid-West | South | West |
| Feb.07 | 3.9% | 14.2% | 3.9% | 1.6% | 0.0% |
| Jan.07 | 2.7% | -0.9% | 4.1% | 2.0% | 5.6% |
| Dec.06 | 0.3% | -0.9% | 2.8% | 0.8% | -2.3% |
| Nov.06 | -0.3% | 4.9% | 0.0% | -2.0% | -1.5% |
| 3-Mo: ar | 28.2% | 48.1% | 45.1% | 17.8% | 12.5% |
| 6-mo: ar | 12.0% | 28.3% | 21.0% | 4.8% | 4.7% |
| 1-Year | -3.6% | 3.4% | -1.9% | -4.4% | -9.6% |
| Prices: | Median Prices | ||||
| One Mo: | 0.9% | 1.4% | -2.7% | 0.4% | 4.8% |
| One Year: | -1.3% | -1.4% | -1.3% | -2.9% | 2.2% |
| Average Prices | |||||
| One Year: | -0.4% | -0.4% | 0.1% | -2.4% | 1.5% |
by Carol Stone March 23, 2007
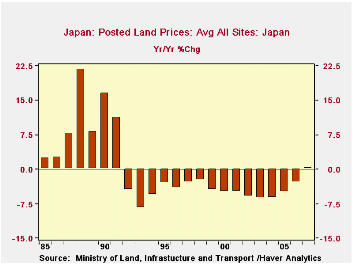
Prices of land in Japan rose 0.4% from January 1, 2006, to January 1, 2007, according to a report issued late Thursday in Japan by the Ministry of Land, Infrastructure and Transport. This is the first increase in land prices since the year to January 1, 1991, that is 16 years. Over that period, land values fell by more than half, by 52.1%, to a level last seen in 1982. The latest increase is, of course, hardly anything, but this long, excruciating decline seems to have ended, in still another sign that the Japanese economy, however haltingly, may be making further progress toward sustained expansion.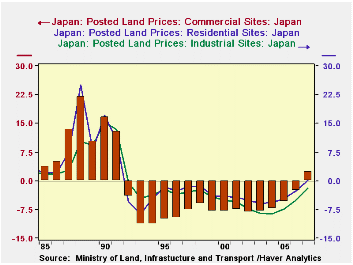
Commercial business sites showed the largest gain, up 2.3%, with a substantial 9.4% rise in the Tokyo market. These prices had also risen last year in Tokyo, by 1.0%. Residential land throughout Japan edged higher in the latest year, this by just 0.1%, with Tokyo up 3.6%, Osaka 1.8% and Nagoya 1.7%. While these three major metropolitan areas are seeing renewed strength, prices of residential sites in "local districts" were still down, by 2.7% on average. Values of so-called "prospective housing land" were also still weak, down 4.3%, implying that not much enthusiasm for new housing development has emerged. And industrial building sites, too, are still declining in value, although the decrease of 1.8% to January 1, 2007, is the smallest reduction since 1992; these values did increase in the latest reading for the three main metro areas that the Land Ministry reports. Further, property values for light industry, or "quasi-industry", did rise, also due to gains in the big cities.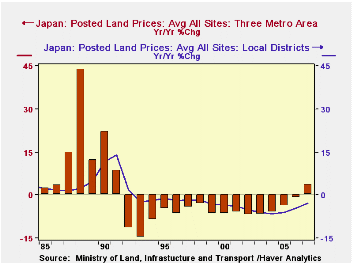
Back in the 1980s, land prices were skyrocketing, and owing to the organization of Japanese real estate holdings, it was thought that the "tradable" supply of land was so small and demand for land in the vibrant Japanese economy so large that property prices might never fall. But the tight money policies in 1989 and 1990, meant to curb stock speculation as well as that in real estate, did result in a downturn in land values. Over time, it seemed the persistent cuts in property values would then, ironically, never end. But apparently they have. This is uneven, as we have seen, and has yet to pick up in the outlying, "local districts". But the first forward steps have been taken.
| JAPAN: % Change as of January 1 |
2007 | 2006 | 2005 | Average, 2000-2004 | Average, 1995-1999 |
|---|---|---|---|---|---|
| All Sites: Japan | 0.4 | -2.8 | -5.0 | -5.7 | -3.4 |
| Tokyo | 4.6 | -0.7 | -3.2 | -6.2 | -5.6 |
| Residential: Japan | 0.1 | -2.7 | -4.6 | -5.0 | -2.2 |
| Tokyo | 3.6 | -0.9 | -3.2 | -5.8 | -4.1 |
| Commercial: Japan | 2.3 | -2.7 | -5.6 | -7.8 | -8.4 |
| Tokyo | 9.4 | 1.0 | -2.5 | -7.1 | -12.8 |
| Industrial: Japan | -1.8 | -4.9 | -7.4 | -7.0 | -3.1 |
| Tokyo | 0.9 | -4.1 | -7.4 | -9.6 | -6.0 |

Robert Brusca
AuthorMore in Author Profile »Robert A. Brusca is Chief Economist of Fact and Opinion Economics, a consulting firm he founded in Manhattan. He has been an economist on Wall Street for over 25 years. He has visited central banking and large institutional clients in over 30 countries in his career as an economist. Mr. Brusca was a Divisional Research Chief at the Federal Reserve Bank of NY (Chief of the International Financial markets Division), a Fed Watcher at Irving Trust and Chief Economist at Nikko Securities International. He is widely quoted and appears in various media. Mr. Brusca holds an MA and Ph.D. in economics from Michigan State University and a BA in Economics from the University of Michigan. His research pursues his strong interests in non aligned policy economics as well as international economics. FAO Economics’ research targets investors to assist them in making better investment decisions in stocks, bonds and in a variety of international assets. The company does not manage money and has no conflicts in giving economic advice.
More Economy in Brief


