 Global| Feb 28 2007
US 4Q GDP Revised Down to 2.2% Growth, in Line with Forecasts
Summary
U.S. real GDP grew 2.2% (AR) last quarter, revised from the unexpectedly large 3.5% reported last month. After release of December construction, trade and inventory data, market forecasters estimated the change to GDP fairly well in [...]
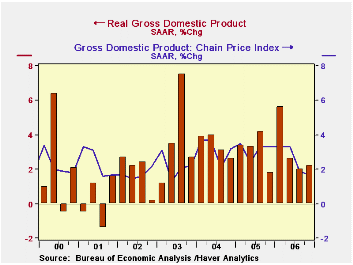
U.S. real GDP grew 2.2% (AR) last quarter, revised from the unexpectedly large 3.5% reported last month. After release of December construction, trade and inventory data, market forecasters estimated the change to GDP fairly well in line with what the BEA reported this morning. The reduction in Q4 lowered growth for the entirety of 2006 by 0.1% to 3.3%.
The largest difference between the Advance and Preliminary reports came in inventories. Initially reported with a $20.1 billion liquidation in real terms, they were chopped $18.0 billion more in this revision; the total $38.1 billion inventory liquidation took away 1.4% from total growth versus 0.7% in last month's report.
The contribution from net exports was reduced from 1.6 percentage points to 1.5 points as a sizable upward revision to exports of services (13.0% gain to 15.5%) was more than offset by the effect of a smaller contraction in imports, 2.2% versus 3.2% estimated before. This was still the largest contribution from net exports since Q4 1996.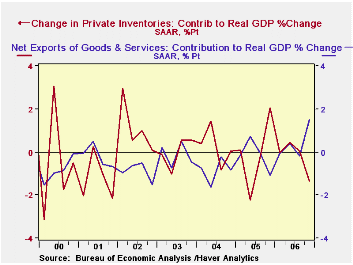 Final sales to domestic purchasers were reduced from the Advance estimate of 2.4% growth to 2.0%. Personal consumption expenditures grew 4.2%, a bit lower than the 4.4% reported before; both durable and nondurable goods had slower growth than the initial report, but consumption of services was revised modestly higher. Residential investment was marginally less weak than the previous estimate, now showing a 19.1% decrease compared with 19.2% before.
Nonresidential fixed investment fell 2.4%, revised from 0.4%, after a 10.0% gain the prior quarter. Outlays for structures were slashed from 2.8% growth to an 0.8% rate of decline. Equipment spending also saw a sizable downward shift from -1.8% to -3.2% in the Q4 estimate, following 7.7% in Q3.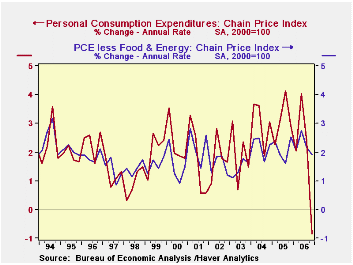
The GDP chain price index was lifted slightly to a 1.7% gain from 1.5%; despite the increase, this remains the weakest quarterly advance since early 2003. The overall PCE chain price index was lowered from -0.8% to -0.9%. This was the first outright quarterly decline in PCE prices since 1961. The "core" PCE chain price index less food and energy rose 1.9%, a modest downward revision, as well, from the advance report of 2.1% and from 2.2% in Q3.
| Chained 2000$, % AR | 4Q '06 | 4Q '06 | 3Q '06 | Y/Y | 2006 | 2005 | 2004 |
|---|---|---|---|---|---|---|---|
| GDP | 2.2% | 3.5% | 2.0% | 3.1% | 3.3% | 3.2% | 3.9% |
| Inventory Effect | -1.4% | -0.7% | 0.1% | -0.2% | 0.2% | -0.3% | 0.4% |
| Final Sales | 3.6% | 4.2% | 1.9% | 3.3% | 3.1% | 3.5% | 3.5% |
| Foreign Trade Effect | 1.5% | 1.6% | -0.2% | 0.6% | 0.0% | -0.1% | -0.5% |
| Domestic Final Demand | 2.1% | 2.4% | 2.0% | 2.7% | 3.1% | 3.6% | 4.0% |
| Chained GDP Price Index | 1.7% | 1.5% | 1.9% | 2.5% | 2.9% | 3.0% | 2.8% |
by Carol Stone February 28, 2007
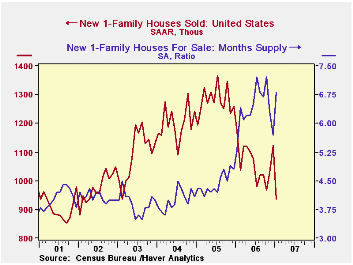
A month ago here, Tom Moeller explained that mild weather was likely behind an unexpectedly strong performance for new home sales. They were up 4.8% from November, which itself had risen markedly. All of that has now been reversed as sales in January dropped 16.6% to 937,000 from a modestly revised December total of 1.123M. The January figure is the lowest since 936,000 in February 2003, nearly four years ago. Some change in the weather was probably responsible for this latest move too, as the national average of heating degree days rose from a very low number in December to a near-average number for January.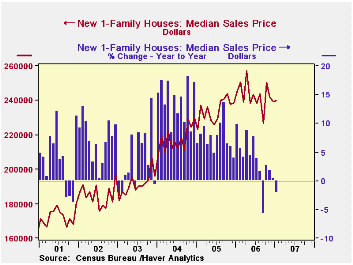
January sales were down sharply in every region: in the Northeast, they fell 18.7% (but just 1.6% y/y). In the Midwest, they were off 8.1% and actually maintained a slim gain of 0.6% y/y. Sales in the South fell 9.7% in the month and were down 11.2% from the year earlier. Finally, as with existing home sales, the greatest weakness is in the West. New home sales there slid 37.4% in January to just 166,000, down 50.4% from January 2006 and the lowest since March 1995.
The decline in total sales brought to an end a string of reductions in the inventory of unsold homes, four in a row and five of the last six months. The change was not great, just 540,000 at end-January from 539,000 at end-December, but the drop in sales volume meant that the months' supply at current volume jumped from 5.7 to 6.8, a large one-month increase.
The median new home price rose 0.2% from December to $239,800 (-2.1% from January 2006). There were noticeable upward revisions to prior months, however, including nearly $10,000 in November. The year 2006 now shows a 3.7% rise, not strong, surely, but also not nearly as weak as previously calculated.All the data discussed here are contained in Haver's USECON database, the home sales under "Housing and Construction" and the heating-degree days under "Other Statistics", which also includes monthly average temperatures and inches of precipitation.
| US New Homes | Jan 2007 | Dec 2006 | M/M | Y/Y | 2006 | 2005 | 2004 |
|---|---|---|---|---|---|---|---|
| Total Sales (SAAR, 000s) | 937 | 1,123 | -16.6% | -21.3% | 1,070 | 1,280 | 1,201 |
| Median Price (NSA, $) | 239,800 | 239,400 | -0.2% | -2.1% | 241,125 | 234,208 | 217,817 |
Carol Stone, CBE
AuthorMore in Author Profile »Carol Stone, CBE came to Haver Analytics in 2003 following more than 35 years as a financial market economist at major Wall Street financial institutions, most especially Merrill Lynch and Nomura Securities. She had broad experience in analysis and forecasting of flow-of-funds accounts, the federal budget and Federal Reserve operations. At Nomura Securities, among other duties, she developed various indicator forecasting tools and edited a daily global publication produced in London and New York for readers in Tokyo. At Haver Analytics, Carol was a member of the Research Department, aiding database managers with research and documentation efforts, as well as posting commentary on select economic reports. In addition, she conducted Ways-of-the-World, a blog on economic issues for an Episcopal-Church-affiliated website, The Geranium Farm. During her career, Carol served as an officer of the Money Marketeers and the Downtown Economists Club. She had a PhD from NYU's Stern School of Business. She lived in Brooklyn, New York, and had a weekend home on Long Island.
More Economy in Brief


