 Global| Oct 28 2005
US 3Q GDP Grew 3.8%
by:Tom Moeller
|in:Economy in Brief
Summary
US real GDP grew 3.8% (AR) last quarter and slightly beat Consensus expectations for 3.6% growth. That strength versus 3.3% growth during 2Q '05 came despite an unspecified subtraction (perhaps 0.2 percentage points) due to Hurricanes [...]
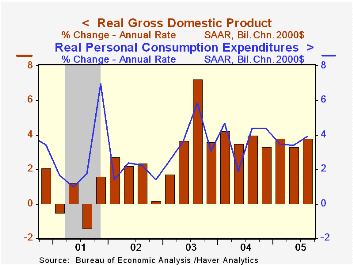
Domestic demand growth remained firm at 4.1% due to 3.9% (3.8% y/y) growth in real PCE which was powered by a 17.6% (4.6% y/y) jump in motor vehicle purchases. Spending on furniture & household appliances also jumped 12.1% (9.0% y/y) and services spending rose 3.2%. (3.0% y/y).
Investment spending remained strong. Business fixed investment rose 6.2% (7.8% y/y) due to an 8.9% (10.1% y/y) gain in equipment & software. Structures spending fell 1.4% (+1.0% y/y). Residential investment continued higher yet the 4.8% (6.6% y/y) increase lagged the 10.8% growth during 2Q.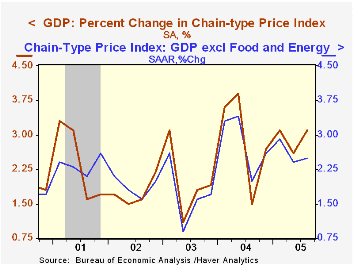
Inventory accumulation continued to have a negative effect on GDP growth. The 0.6 percentage point subtraction was lower than during 2Q but it was the fourth subtraction in the last five quarters.
A shallower foreign trade deficit added marginally to GDP growth following the 1.1 percentage point add during 2Q. Exports continued higher although the 0.7% (6.5% y/y) rise was well off the pace of the prior two years during which quarterly export growth averaged 7.7%.Imports fell slightly (+4.5% y/y) for the second consecutive quarter.
The chain price index rose 3.1%, elevated from 2Q due to the surge in energy prices. Less food & energy the GDP chain price index rose 2.5%, the same as during the prior two years. The chain price index for domestic final demand rose 4.0% after an elevated 3.3% gain in 2Q yet less food & energy the 2.2% gain was a hair below the 2.5% averaged during the prior two years.
| Chained 2000$, % AR | 3Q '05 (Advance) | 2Q '05 | Y/Y | 2004 | 2003 | 2002 |
|---|---|---|---|---|---|---|
| GDP | 3.8% | 3.3% | 3.6% | 4.2% | 2.7% | 1.6% |
| Inventory Effect | -0.6% | -2.1% | -0.6% | 0.3% | 0.0% | 0.4% |
| Final Sales | 4.4% | 5.6% | 4.2% | 3.9% | 2.7% | 1.2% |
| Foreign Trade Effect | 0.1% | 1.1% | 0.2% | -0.5% | -0.3% | -0.6% |
| Domestic Final Demand | 4.1% | 4.2% | 4.0% | 4.4% | 3.0% | 1.8% |
| Chained GDP Price Index | 3.1% | 2.6% | 2.9% | 2.6% | 2.0% | 1.7% |
by Tom Moeller October 28, 2005
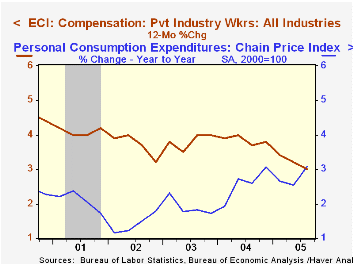
The employment cost index for private industry workers rose 0.8% last quarter. The increase was up from the 0.6% 2Q gain and equaled Consensus expectations.Year to year, the ECI's gain of 3.0% was the slowest since early 1999.
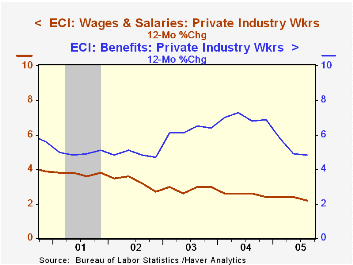
Benefit costs increased 1.3%, up from the slow 0.8% 2Q gain and it was the quickest this year. Benefit costs in service occupations rose 1.1% (2.8% y/y) and benefit costs in manufacturing rose 1.6% (5.5% y/y).
 The y/y gain in the cost of health benefits rose to 6.7% but that remained down from a 7.3% increase last year and a 10.5% gain in 2003.
Wage and salary growth was stable at 0.6% for the third straight quarter. Wages account for roughly 70% of the compensation index.
It's Who You Are and What You Do: Explaining the IT Industry Wage Premium from the Federal Reserve Bank of Atlanta is available here.
| ECI- Private Industry Workers | 3Q '05 | 2Q '05 | Y/Y | 2004 | 2003 | 2002 |
|---|---|---|---|---|---|---|
| Compensation | 0.8% | 0.6% | 3.0% | 3.8% | 4.0% | 3.2% |
| Wages & Salaries | 0.6% | 0.6% | 2.2% | 2.4% | 3.0% | 2.7% |
| Benefit Costs | 1.3% | 0.8% | 4.8% | 6.9% | 6.4% | 4.7% |
by Tom Moeller October 28, 2005
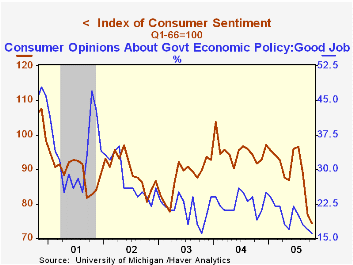
The October reading of consumer sentiment from the University of Michigan settled at 74.2. That was down marginally from the mid-month reading of 75.4 but it was down 3.5% from September which fell 13.7% from August. Consensus expectations had been for improvement to 76.0 and the latest was the lowest reading since October 1992.
During the last ten years there has been a 78% correlation between the level of consumer sentiment and the y/y change in real consumer spending.
The current conditions index fell 7.0% m/m (-12.3% y/y) for the third consecutive sharp monthly decline. Consumers' opinion of the government's economic policy fell to its lowest since 1996 and the read of personal finances fell 6.8% m/m (-14.3% y/y), a significant deterioration from the mid-month read.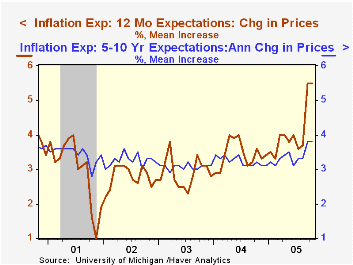
Consumer expectations fell just 0.2% after two months of double digit decline. Expected personal finances fell 2.6% (-11.8% y/y) and expected business conditions during the next five years fell 5.3% (-25.8% y/y).
The mean expected inflation rate for the next twelve months was stable at 5.5% and that was a slight nudge up from the 5.4% expectation at mid-month. The mean expected rate of inflation of 3.8% during the next five to ten years is the highest since 1997.
The University of Michigan survey is not seasonally adjusted.The mid-month survey is based on telephone interviews with 250 households nationwide on personal finances and business and buying conditions. The survey is expanded to a total of 500 interviews at month end.
| University of Michigan | Oct | Sept | Y/Y | 2004 | 2003 | 2002 |
|---|---|---|---|---|---|---|
| Consumer Sentiment | 74.2 | 76.9 | -19.1% | 95.2 | 87.6 | 89.6 |
| Current Conditions | 91.2 | 98.1 | -12.3% | 105.6 | 97.2 | 97.5 |
| Expectations | 63.2 | 63.3 | -24.6% | 88.5 | 81.4 | 84.6 |
by Carol Stone October 28, 2005
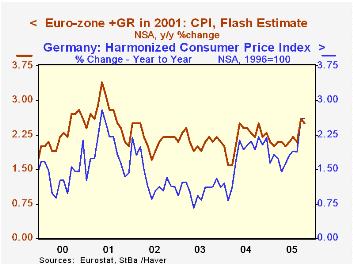
Inflation appears to be no worse for October than it was in September, according to very preliminary data released today and, for Germany, this past Tuesday. The overall Euro-Zone harmonized CPI (HICP) "Flash" was up 2.5% on the year ago, compared with 2.6% in September. An increase in the base-period amount is partly responsible for this month's downtick in the 12-month inflation rate, but even after accounting for that, prices did not accelerate in October. Among the countries available so far, Germany's 12-month inflation was stable in the two months at 2.6% and Spain's decreased to 3.5% in October from 3.8% in September. In Italy, by contrast, October's rate is 2.5%, relative to 2.2% the previous month. [All figures here reflect the HICP definition of CPI.]
Elsewhere, the Japanese sub-index for the Tokyo region fell more, 1.0%, this month than the -0.6% in September.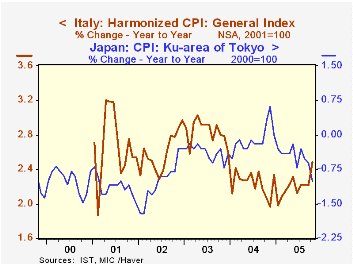
Little detail is available with these early reports, so it is hard to analyze the forces producing the latest reading on world inflation. Two regions provided some breakdown, Italy and Tokyo, Japan. Considering Tokyo first, where prices weakened, there was a notable advance in the base period level, establishing a bias toward a drop in year-on-year inflation. Weaker prices appeared in food, housing, apparel and recreation; they firmed for utilities -- hardly surprising -- furniture and "other". Pretty much of a mixed bag, then. The same seems to be the case in Italy. First, the base-period effect contributes to the increase in the 12-month pace, as inflation slowed in October last year. This year, the month-to-month CPI change was 0.5% in both September and October. In Italy, prices accelerated in housing, transportation and hotels and restaurants, and they fell less in health care and communications. They increased at basically a steady rate in food and "other" categories. On the other side, they slowed in apparel, recreation and culture, and education. So a mixed performance here too. There is one encouraging note that applies to both of these far-flung places: food and apparel costs remained slow. Thus, as people face a squeeze on their energy bills this winter, the budget burden from other basic necessities seems to lighten. Further, energy itself may have already started to moderate.
| Consumer Price Index: Yr/Yr % Change, NSA |
Oct 2005 | Sept 2005 | Aug 2005 | 2004 | 2003 | 2002 |
|---|---|---|---|---|---|---|
| Euro-Zone "Flash" | 2.5 | 2.6 | 2.2 | 2.4 | 2.0 | 2.3 |
| Germany | 2.6 | 2.6 | 1.9 | 2.2 | 1.1 | 1.1 |
| Italy | 2.5 | 2.2 | 2.2 | 2.3 | 2.6 | 3.0 |
| Spain | 3.5 | 3.8 | 3.3 | 3.3 | 2.7 | 4.0 |
| Japan: Tokyo Area | -1.0 | -0.6 | -0.5 | 0.0 | -0.4 | -0.3 |
| Japan: Total | -- | -0.3 | -0.3 | 0.2 | -0.4 | -0.3 |

Tom Moeller
AuthorMore in Author Profile »Prior to joining Haver Analytics in 2000, Mr. Moeller worked as the Economist at Chancellor Capital Management from 1985 to 1999. There, he developed comprehensive economic forecasts and interpreted economic data for equity and fixed income portfolio managers. Also at Chancellor, Mr. Moeller worked as an equity analyst and was responsible for researching and rating companies in the economically sensitive automobile and housing industries for investment in Chancellor’s equity portfolio. Prior to joining Chancellor, Mr. Moeller was an Economist at Citibank from 1979 to 1984. He also analyzed pricing behavior in the metals industry for the Council on Wage and Price Stability in Washington, D.C. In 1999, Mr. Moeller received the award for most accurate forecast from the Forecasters' Club of New York. From 1990 to 1992 he was President of the New York Association for Business Economists. Mr. Moeller earned an M.B.A. in Finance from Fordham University, where he graduated in 1987. He holds a Bachelor of Arts in Economics from George Washington University.
More Economy in Brief


