 Global| Dec 21 2009
United States' Home PricePerformance All Over The Map
by:Tom Moeller
|in:Economy in Brief
Summary
Recent signs of stability in home sales and construction hold promise that deflation in home prices is abating. Of course, that depends on whether the only reason for pricing improvement is due to the increased affordability of [...]
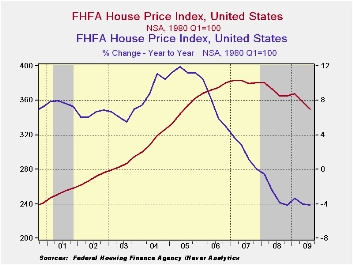
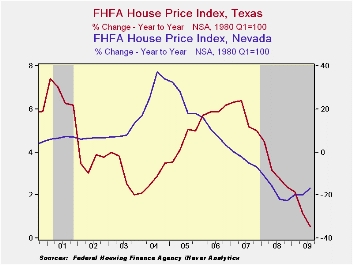
Recent signs of stability in home sales and construction hold promise that deflation in home prices is abating. Of course, that depends on whether the only reason for pricing improvement is due to the increased affordability of housing created by past price declines. Positive growth in jobs and income would support a more lasting bottom in pricing power ... then growth in housing sector activity. States' home price data in the table below is arranged by highest-to-lowest y/y change during all of last year. The difference between the state with the best performance (Texas) and the worst performance (Nevada) is a huge twenty percentage points. Versus 2007, the rate of price change slowed throughout the country, but nowhere was it more pronounced than in California; to a 17.2% rate of decline from negative 4.7%.
 Through the third quarter of this year, home price declines
occurred in all but a few states. For the country as a whole home
prices fell another 4.1% y/y during 3Q after the 2.7% decline during
2008. So far this year, however, the rate of price decline has
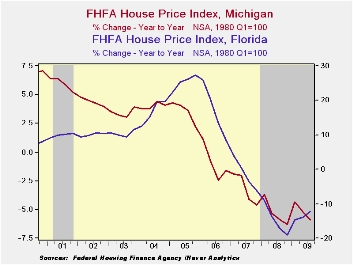
stabilized. The good news was that the rate of price deflation both in
Florida and California slowed versus 2008. In fact, the rate of home
price decline halved in California. Alabama, North Carolina and Indiana
are three states where earlier stability in home prices gave way to
deflation. Past stability was, however, tenuous as price appreciation
already had slowed appreciably. In Texas, Nebraska and Louisiana home
price gains all but disappeared.
Through the third quarter of this year, home price declines
occurred in all but a few states. For the country as a whole home
prices fell another 4.1% y/y during 3Q after the 2.7% decline during
2008. So far this year, however, the rate of price decline has
stabilized. The good news was that the rate of price deflation both in
Florida and California slowed versus 2008. In fact, the rate of home
price decline halved in California. Alabama, North Carolina and Indiana
are three states where earlier stability in home prices gave way to
deflation. Past stability was, however, tenuous as price appreciation
already had slowed appreciably. In Texas, Nebraska and Louisiana home
price gains all but disappeared.
 Where home prices go from here clearly is a hard call. And as
individual states' recent performance indicates, much of the story may
be local. Is there a heavy concentration of certain industries in the
state such as finance or defense, or were a state's home prices
inordinately influenced by speculative forces. Home Prices: A
Case for Cautious Optimism from the Federal Reserve Bank of
St. Louis is available here.
Where home prices go from here clearly is a hard call. And as
individual states' recent performance indicates, much of the story may
be local. Is there a heavy concentration of certain industries in the
state such as finance or defense, or were a state's home prices
inordinately influenced by speculative forces. Home Prices: A
Case for Cautious Optimism from the Federal Reserve Bank of
St. Louis is available here.
The latest report from the Federal Housing Finance Agency can be found here.
The states' home price figures can be found in Haver's REGIONAL database.
| Median Price of Single-family Homes (y/y % Chg.) | 3Q '09 | 2008 | 2007 | 2006 | 2005 |
|---|---|---|---|---|---|
| Texas | 0.5 | 3.2 | 5.7 | 5.9 | 4.4 |
| Alabama | -1.1 | 2.5 | 5.1 | 8.1 | 7.2 |
| North Carolina | -2.1 | 2.2 | 6.0 | 7.7 | 6.5 |
| Tennessee | -1.1 | 1.7 | 5.2 | 7.4 | 6.6 |
| Louisiana | 0.4 | 1.6 | 5.5 | 11.2 | 7.0 |
| Colorado | -1.7 | 0.8 | 2.0 | 3.2 | 5.0 |
| Indiana | -1.3 | 0.7 | 1.9 | 1.9 | 3.9 |
| Arkansas | -0.8 | 0.6 | 3.7 | 6.5 | 7.4 |
| Nebraska | 0.7 | 0.4 | 1.7 | 2.3 | 4.6 |
| Missouri | -1.8 | -0.1 | 2.5 | 4.3 | 6.7 |
| Wisconsin | -1.9 | -0.3 | 1.8 | 3.8 | 7.9 |
| Maine | -3.2 | -0.4 | 2.0 | 4.8 | 11.3 |
| Washington | -8.3 | -1.3 | 7.5 | 15.7 | 15.8 |
| New York | -4.0 | -1.8 | 1.4 | 7.3 | 13.1 |
| U.S. Total | -4.1 | -2.7 | 1.9 | 7.3 | 11.4 |
| Connecticut | -4.8 | -3.0 | 0.9 | 5.9 | 12.3 |
| Virginia | -4.2 | -3.2 | 2.3 | 10.8 | 19.1 |
| Hawaii | -8.2 | -3.8 | 2.5 | 14.4 | 24.1 |
| Massachusetts | -3.4 | -3.9 | -2.7 | 1.0 | 9.4 |
| New Jersey | -6.0 | -4.1 | 0.6 | 9.1 | 15.7 |
| District of Columbia | -3.9 | -4.8 | 3.1 | 12.1 | 23.0 |
| Michigan | -5.9 | -5.3 | -3.1 | -1.0 | 3.6 |
| Maryland | -7.4 | -5.8 | 2.3 | 13.2 | 21.3 |
| Rhode Island | -6.8 | -6.6 | -2.0 | 4.5 | 13.6 |
| Arizona | -13.6 | -11.9 | -0.2 | 19.0 | 29.2 |
| Florida | -12.4 | -14.6 | -1.5 | 16.5 | 25.4 |
| California | -8.4 | -17.2 | -4.7 | 10.2 | 22.8 |
| Nevada | -16.7 | -17.8 | -3.5 | 9.0 | 23.5 |
by Tom Moeller December 21, 2009
 The
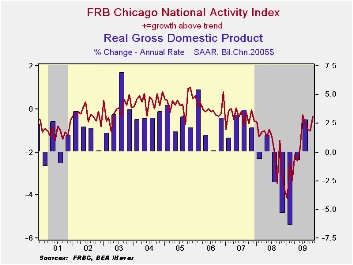
U.S. economy seems to be regaining forward momentum. That is the
indication from the Chicago Fed National Activity Index (CFNAI) from
the Federal Reserve Bank of Chicago. The index improved during November
to a reading of -0.32. That gained back the declines during the prior
three months and pulled the index level to its highest since November
2007, up from the series' low of -4.13 reached this past January. Since
1970 there has been a 74% correlation between the level of the index
and the q/q change in real GDP but during the last ten years that
correlation has risen to 80%.
The
U.S. economy seems to be regaining forward momentum. That is the
indication from the Chicago Fed National Activity Index (CFNAI) from
the Federal Reserve Bank of Chicago. The index improved during November
to a reading of -0.32. That gained back the declines during the prior
three months and pulled the index level to its highest since November
2007, up from the series' low of -4.13 reached this past January. Since
1970 there has been a 74% correlation between the level of the index
and the q/q change in real GDP but during the last ten years that
correlation has risen to 80%.
The three-month moving average which smoothes out some of the volatility of the index also improved to near its highest level since February of 2008.
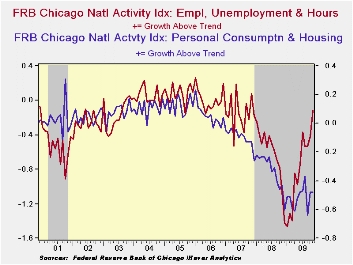 An index
level at or below -0.70 typically has indicated negative U.S. economic
growth. A zero value of the CFNAI indicates that the economy is
expanding at its historical trend rate of growth of roughly 3%. The
complete CFNAI report is available here.·
The Chicago Fed indicated that 36 of the series' individual indicators
made positive contributions to the November index while 49 made
negative contributions. The CFNAI is a weighted average of 85
indicators of economic activity. The indicators reflect activity in the
following categories: production & income, the labor market,
personal consumption & housing, manufacturing & trade
sales, and inventories & orders.
An index
level at or below -0.70 typically has indicated negative U.S. economic
growth. A zero value of the CFNAI indicates that the economy is
expanding at its historical trend rate of growth of roughly 3%. The
complete CFNAI report is available here.·
The Chicago Fed indicated that 36 of the series' individual indicators
made positive contributions to the November index while 49 made
negative contributions. The CFNAI is a weighted average of 85
indicators of economic activity. The indicators reflect activity in the
following categories: production & income, the labor market,
personal consumption & housing, manufacturing & trade
sales, and inventories & orders.
In a separate survey, the Chicago Fed indicated that its Midwest manufacturing index improved modestly during October to its highest level since the June low. Indicators for the auto, steel, machinery and resource sectors each improved. The Chicago Federal Reserve figures are available in Haver's SURVEYS database.
| Chicago Fed | November | October | September | November '08 | 2008 | 2007 | 2006 |
|---|---|---|---|---|---|---|---|
| CFNAI | -0.32 | -1.02 | -0.95 | -2.99 | -1.77 | -0.35 | 0.05 |
| 3-Month Moving Average | -0.77 | -0.87 | -0.61 | -2.63 | -- | -- | -- |
| Personal Consumption & Housing | -0.48 | -0.48 | -0.64 | -0.43 | -0.33 | -0.10 | 0.06 |
| Employment Unemployment & Hours | -0.12 | -0.42 | -0.53 | -1.06 | -0.62 | -0.15 | 0.01 |
| Production & Income | 0.35 | -0.09 | 0.19 | -0.95 | -0.55 | -0.05 | -0.01 |
| Sales, Inventories & Orders | -0.07 | -0.02 | 0.03 | -0.53 | -0.24 | -0.06 | -0.01 |
by Louise Curley December 21, 2009
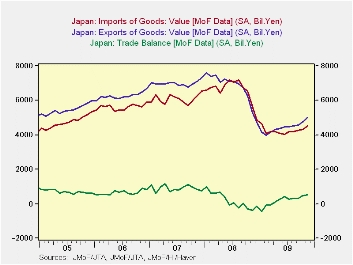 Japanese
balance of trade continues to improve in spite of the
high and rising yen. In November the seasonally adjusted trade balance
was 492.4 billion yen, up from the low point reached in January, 2009
when the balance was a negative 478 billion yen and it is now at the
highest level since April 2008 when the balance was 660 billion yen.
Japanese
balance of trade continues to improve in spite of the
high and rising yen. In November the seasonally adjusted trade balance
was 492.4 billion yen, up from the low point reached in January, 2009
when the balance was a negative 478 billion yen and it is now at the
highest level since April 2008 when the balance was 660 billion yen.
Exports reached a peak of 7,591.4 billion yen in January, 2009 and declined to 3,983.0 in February, 2009. Since then, they have risen to 4,998.0 billion yen. Imports reached a peak in August, 2008 at 7, 209.l and declined to 4.030.6 billion yen in June, 2009. Imports have since recovered to 4,506.1 billion yen. The trends of exports, imports and trade balance are shown in the first chart.
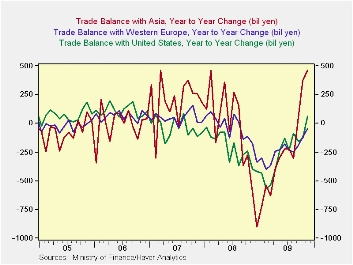 Data on trade by area are not seasonally adjusted. As a
result, trends in these data are best shown by the year over year
changes. The year to year changes for Japan's trade with Asia, Western
Europe and the United States are shown in the second chart. The year to
year change in the trade balance with Asia is the most striking. It has
been positive and increasing since September of the year. The year to
year change in the trade balance with Western Europe is still negative,
but the magnitude of the difference, -44.5 billion yen, is greatly
lower than the -246.4 billion yen recorded in August. 2009. The year to
year change in the trade balance with the United States has also
improved and, for the first time in over two years, was positive.
Data on trade by area are not seasonally adjusted. As a
result, trends in these data are best shown by the year over year
changes. The year to year changes for Japan's trade with Asia, Western
Europe and the United States are shown in the second chart. The year to
year change in the trade balance with Asia is the most striking. It has
been positive and increasing since September of the year. The year to
year change in the trade balance with Western Europe is still negative,
but the magnitude of the difference, -44.5 billion yen, is greatly
lower than the -246.4 billion yen recorded in August. 2009. The year to
year change in the trade balance with the United States has also
improved and, for the first time in over two years, was positive.
| JAPAN TRADE IN GOODS | Nov 09 | Oct 09 | Nov 08 | M/M CHG | Y/Y CHG | 2008 | 2007 | 2006 |
|---|---|---|---|---|---|---|---|---|
| Trade Balance (SA bil yen) | 492.4 | 460.8 | 368.6 | 31.6 | 861.0 | 2244.5 | 10854.4 | 7762.4 |
| Exports | 4998.9 | 4765.3 | 5293.6 | 233.2 | -295.1 | 80916.2 | 83856.4 | 75144.4 |
| Imports | 4506.1 | 4304.6 | 5662.2 | 201.6 | -1156.1 | 78671.7 | 73002.0 | 67382.0 |
| Year to Year Change (bil yen) | Nov 09 | Oct 09 | Sep 09 | Aug 09 | Jul 09 | Jun 09 | May 09 | Apr 09 |
| Trade Balance with Asia | 460.8 | 372.1 | 53.1 | -303.0 | -224.9 | -221.1 | -298.2 | -388.1 |
| Trade Balance with Western Europe | -44.5 | -119.6 | -194.8 | -246.4 | -237.3 | -182.8 | -227.4 | -241.6 |
| Trade Balance with U.S.A | 59.7 | -132.4 | -155.2 | -86.5 | -232.8 | -129.2 | -234.7 | -398.8 |

Tom Moeller
AuthorMore in Author Profile »Prior to joining Haver Analytics in 2000, Mr. Moeller worked as the Economist at Chancellor Capital Management from 1985 to 1999. There, he developed comprehensive economic forecasts and interpreted economic data for equity and fixed income portfolio managers. Also at Chancellor, Mr. Moeller worked as an equity analyst and was responsible for researching and rating companies in the economically sensitive automobile and housing industries for investment in Chancellor’s equity portfolio. Prior to joining Chancellor, Mr. Moeller was an Economist at Citibank from 1979 to 1984. He also analyzed pricing behavior in the metals industry for the Council on Wage and Price Stability in Washington, D.C. In 1999, Mr. Moeller received the award for most accurate forecast from the Forecasters' Club of New York. From 1990 to 1992 he was President of the New York Association for Business Economists. Mr. Moeller earned an M.B.A. in Finance from Fordham University, where he graduated in 1987. He holds a Bachelor of Arts in Economics from George Washington University.
More Economy in Brief


