 Global| Dec 21 2009
United States' Home Price Performance All Over The Map
by:Tom Moeller
|in:Economy in Brief
Summary
Recent signs of stability in home sales and construction hold promise that deflation in home prices is abating. Of course, that depends on whether the only reason for pricing improvement is due to the increased affordability of [...]
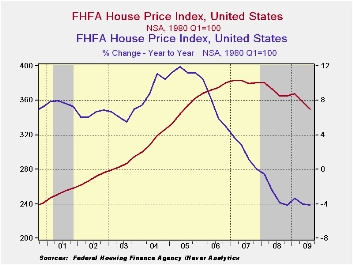
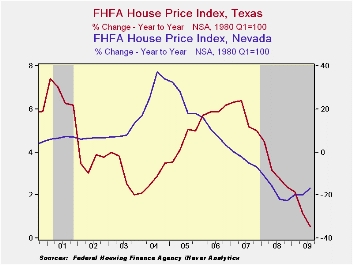
Recent signs of stability in home sales and construction hold promise that deflation in home prices is abating. Of course, that depends on whether the only reason for pricing improvement is due to the increased affordability of housing created by past price declines. Positive growth in jobs and income would support a more lasting bottom in pricing power ... then growth in housing sector activity. States' home price data in the table below is arranged by highest-to-lowest y/y change during all of last year. The difference between the state with the best performance (Texas) and the worst performance (Nevada) is a huge twenty percentage points. Versus 2007, the rate of price change slowed throughout the country, but nowhere was it more pronounced than in California; to a 17.2% rate of decline from negative 4.7%.
 Through the third quarter of this year, home price declines
occurred in all but a few states. For the country as a whole home
prices fell another 4.1% y/y during 3Q after the 2.7% decline during
2008. So far this year, however, the rate of price decline has
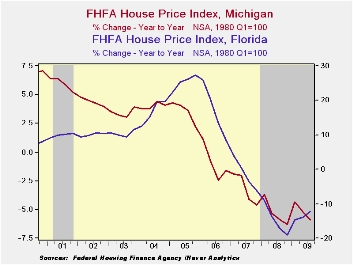
stabilized. The good news was that the rate of price deflation both in
Florida and California slowed versus 2008. In fact, the rate of home
price decline halved in California. Alabama, North Carolina and Indiana
are three states where earlier stability in home prices gave way to
deflation. Past stability was, however, tenuous as price appreciation
already had slowed appreciably. In Texas, Nebraska and Louisiana home
price gains all but disappeared.
Through the third quarter of this year, home price declines
occurred in all but a few states. For the country as a whole home
prices fell another 4.1% y/y during 3Q after the 2.7% decline during
2008. So far this year, however, the rate of price decline has
stabilized. The good news was that the rate of price deflation both in
Florida and California slowed versus 2008. In fact, the rate of home
price decline halved in California. Alabama, North Carolina and Indiana
are three states where earlier stability in home prices gave way to
deflation. Past stability was, however, tenuous as price appreciation
already had slowed appreciably. In Texas, Nebraska and Louisiana home
price gains all but disappeared.
 Where home prices go from here clearly is a hard call. And as
individual states' recent performance indicates, much of the story may
be local. Is there a heavy concentration of certain industries in the
state such as finance or defense, or were a state's home prices
inordinately influenced by speculative forces. Home Prices: A
Case for Cautious Optimism from the Federal Reserve Bank of
St. Louis is available here.
Where home prices go from here clearly is a hard call. And as
individual states' recent performance indicates, much of the story may
be local. Is there a heavy concentration of certain industries in the
state such as finance or defense, or were a state's home prices
inordinately influenced by speculative forces. Home Prices: A
Case for Cautious Optimism from the Federal Reserve Bank of
St. Louis is available here.
The latest report from the Federal Housing Finance Agency can be found here.
The states' home price figures can be found in Haver's REGIONAL database.
| Median Price of Single-family Homes (y/y % Chg.) | 3Q '09 | 2008 | 2007 | 2006 | 2005 |
|---|---|---|---|---|---|
| Texas | 0.5 | 3.2 | 5.7 | 5.9 | 4.4 |
| Alabama | -1.1 | 2.5 | 5.1 | 8.1 | 7.2 |
| North Carolina | -2.1 | 2.2 | 6.0 | 7.7 | 6.5 |
| Tennessee | -1.1 | 1.7 | 5.2 | 7.4 | 6.6 |
| Louisiana | 0.4 | 1.6 | 5.5 | 11.2 | 7.0 |
| Colorado | -1.7 | 0.8 | 2.0 | 3.2 | 5.0 |
| Indiana | -1.3 | 0.7 | 1.9 | 1.9 | 3.9 |
| Arkansas | -0.8 | 0.6 | 3.7 | 6.5 | 7.4 |
| Nebraska | 0.7 | 0.4 | 1.7 | 2.3 | 4.6 |
| Missouri | -1.8 | -0.1 | 2.5 | 4.3 | 6.7 |
| Wisconsin | -1.9 | -0.3 | 1.8 | 3.8 | 7.9 |
| Maine | -3.2 | -0.4 | 2.0 | 4.8 | 11.3 |
| Washington | -8.3 | -1.3 | 7.5 | 15.7 | 15.8 |
| New York | -4.0 | -1.8 | 1.4 | 7.3 | 13.1 |
| U.S. Total | -4.1 | -2.7 | 1.9 | 7.3 | 11.4 |
| Connecticut | -4.8 | -3.0 | 0.9 | 5.9 | 12.3 |
| Virginia | -4.2 | -3.2 | 2.3 | 10.8 | 19.1 |
| Hawaii | -8.2 | -3.8 | 2.5 | 14.4 | 24.1 |
| Massachusetts | -3.4 | -3.9 | -2.7 | 1.0 | 9.4 |
| New Jersey | -6.0 | -4.1 | 0.6 | 9.1 | 15.7 |
| District of Columbia | -3.9 | -4.8 | 3.1 | 12.1 | 23.0 |
| Michigan | -5.9 | -5.3 | -3.1 | -1.0 | 3.6 |
| Maryland | -7.4 | -5.8 | 2.3 | 13.2 | 21.3 |
| Rhode Island | -6.8 | -6.6 | -2.0 | 4.5 | 13.6 |
| Arizona | -13.6 | -11.9 | -0.2 | 19.0 | 29.2 |
| Florida | -12.4 | -14.6 | -1.5 | 16.5 | 25.4 |
| California | -8.4 | -17.2 | -4.7 | 10.2 | 22.8 |
| Nevada | -16.7 | -17.8 | -3.5 | 9.0 | 23.5 |

Tom Moeller
AuthorMore in Author Profile »Prior to joining Haver Analytics in 2000, Mr. Moeller worked as the Economist at Chancellor Capital Management from 1985 to 1999. There, he developed comprehensive economic forecasts and interpreted economic data for equity and fixed income portfolio managers. Also at Chancellor, Mr. Moeller worked as an equity analyst and was responsible for researching and rating companies in the economically sensitive automobile and housing industries for investment in Chancellor’s equity portfolio. Prior to joining Chancellor, Mr. Moeller was an Economist at Citibank from 1979 to 1984. He also analyzed pricing behavior in the metals industry for the Council on Wage and Price Stability in Washington, D.C. In 1999, Mr. Moeller received the award for most accurate forecast from the Forecasters' Club of New York. From 1990 to 1992 he was President of the New York Association for Business Economists. Mr. Moeller earned an M.B.A. in Finance from Fordham University, where he graduated in 1987. He holds a Bachelor of Arts in Economics from George Washington University.
More Economy in Brief


