 Global| May 02 2003
Unemployment Up, Nonfarm Payrolls Down
by:Tom Moeller
|in:Economy in Brief
Summary
The unemployment rate rose to 6.0% in April, back to the level of last December. Consensus expectations had been for a rise to 5.9%. Employment rose 339,000 (+1.1% y/y) following two months of slight decline. The labor force surged [...]
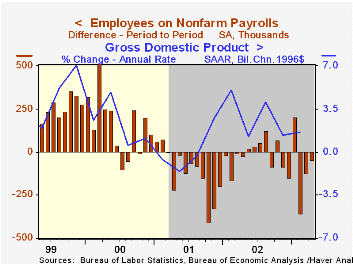
The unemployment rate rose to 6.0% in April, back to the level of last December. Consensus expectations had been for a rise to 5.9%. Employment rose 339,000 (+1.1% y/y) following two months of slight decline. The labor force surged 680,000 (+1.2% y/y).
Nonfarm payrolls fell in April by 48,000. So far this year nonfarm payrolls have fallen 322,000, or 0.2%. Consensus had expected a 50,000 worker decline in April. The decline in March payrolls was deepened to a loss of 124,000 from a loss of 108,000 reported last month.
The one month diffusion index for nonfarm payrolls was unchanged at a still-low 48.6, so it continued to suggest poor hiring prospects. The three month diffusion index was unchanged at 39.8. By measuring the breadth of hiring increases, these indexes are leading indicators of job growth.
Where Jobs Fell: The number of factory sector jobs fell 95,000 (-0.6% m/m, -3.3% y/y), the most for any one month since January 2002. The one-month diffusion index for the factory sector fell to 33.8 from an upwardly revised March. That was the lowest breadth of gain in factory sector jobs since December 2001. Retail hiring fell another 10,000 (-1.0% y/y). Transportation and public utilities industries shed 19,000 (-2.5% y/y) jobs.
Where Jobs Rose: Construction jobs rose 18,000 (0.2% y/y) for the second consecutive monthly gain. Jobs in service producing industries rose 25,000 for the first gain in three months. All of the gain was due to a 32,000 worker rise in government payrolls. The number of services jobs rose 21,000 (0.9% y/y) and employment in finance, insurance and real estate rose 7,000 (1.3% y/y).
The index of aggregate hours worked (employment times hours worked) fell 0.7% in April so it began 2Q 0.7% below the average for 1Q. Hours worked fell 0.4% (AR) in 1Q versus 4Q02.Over the last ten years there has been a 58% correlation between the quarterly change in aggregate hours worked and real GDP. That correlation is down from 89% in the 1980s. The decline is due to the recent acceleration in productivity growth.
Average hourly earnings rose just 0.1%, slightly less than expected.
The nonfarm payroll employment figures are based on reports provided to the US Labor Department by businesses, while the figures from which the unemployment rate is derived are based on a survey of US households.
Research from the Federal Reserve Bank of St. Louis which highlights recent regional employment trends can be found here.
| Employment | April | Mar | Y/Y | 2002 | 2001 | 2000 |
|---|---|---|---|---|---|---|
| Payroll Employment | -48,000 | -124,000 | -0.3% | -0.9% | 0.2% | 2.2% |
| Manufacturing | -95,000 | -43,000 | -3.3% | -5.5% | -4.2% | -0.4% |
| Average Weekly Hours | 34.0 | 34.3 | 34.2 | 34.2 | 34.2 | 34.4 |
| Average Hourly Earnings | 0.1% | 0.1% | 3.1% | 3.2% | 4.0% | 3.8% |
| Unemployment Rate | 6.0% | 5.8% | 5.9% | 5.8% | 4.8% | 4.0% |
by Tom Moeller May 2, 2003
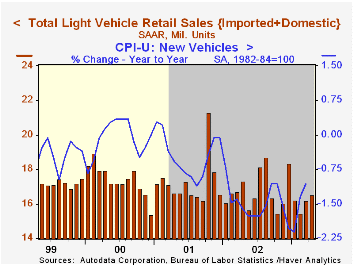
Unit sales of light vehicles rose to an expected sales rate of 16.5 million units in April. Sales rose 1.9% from March and the gain was to the highest sales rate of the year.
Consensus expectations were for a 16.6 mil. unit sales rate.
Sales of cars fell 3.1% m/m and were down 11.6% y/y. Truck sales rose 6.5% m/m and were up 1.6% y/y.
| Light Vehicle Sales (SAAR, Mil.Units) | April | Mar | Y/Y | 2002 | 2001 | 2000 |
|---|---|---|---|---|---|---|
| Total | 16.50 | 16.19 | -4.8% | 16.81 | 17.26 | 17.40 |
| Autos | 7.50 | 7.74 | -11.6% | 8.07 | 8.48 | 8.83 |
| Light Trucks | 9.00 | 8.45 | 1.6% | 8.74 | 8.78 | 8.56 |
by Tom Moeller May 2, 2003
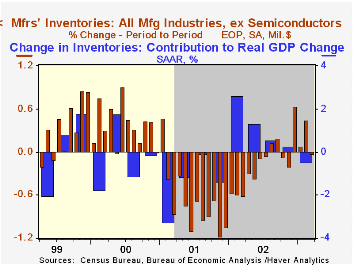
Manufacturing inventories fell, but just slightly, in March. The reading followed three consecutive months of accumulation.
Sharp decumulation of automobiles and light trucks led the turn away from accumulation in March, but inventories of computers and electronic products also fell sharply for the fourth straight month.
Nondurable goods inventories rose a slight 0.3% (+4.1% y/y).
Factory shipments rose 1.9% for the second strong monthly gain this year.
Factory orders surged 2.2%. Durable goods orders rose 1.5%, revised down from a 2.0% rise in the advance report. Nondurable goods orders rose 3.0% (7.8% y/y).
| Factory Survey (NAICS) | Mar | Feb | Y/Y | 2002 | 2001 | 2000 |
|---|---|---|---|---|---|---|
| Inventories | -0.0% | 0.4% | 0.4% | -1.9% | -8.0% | 4.5% |
| New Orders | 2.2% | -1.0% | 4.2% | -0.8% | -7.2% | 5.2% |
| Shipments | 1.9% | -1.4% | 4.2% | -1.1% | -5.3% | 4.4% |

Tom Moeller
AuthorMore in Author Profile »Prior to joining Haver Analytics in 2000, Mr. Moeller worked as the Economist at Chancellor Capital Management from 1985 to 1999. There, he developed comprehensive economic forecasts and interpreted economic data for equity and fixed income portfolio managers. Also at Chancellor, Mr. Moeller worked as an equity analyst and was responsible for researching and rating companies in the economically sensitive automobile and housing industries for investment in Chancellor’s equity portfolio. Prior to joining Chancellor, Mr. Moeller was an Economist at Citibank from 1979 to 1984. He also analyzed pricing behavior in the metals industry for the Council on Wage and Price Stability in Washington, D.C. In 1999, Mr. Moeller received the award for most accurate forecast from the Forecasters' Club of New York. From 1990 to 1992 he was President of the New York Association for Business Economists. Mr. Moeller earned an M.B.A. in Finance from Fordham University, where he graduated in 1987. He holds a Bachelor of Arts in Economics from George Washington University.
More Economy in Brief


