 Global| Jul 07 2008
UK IP Trends Turn Lower
Summary
UK IP is now lower in two of the past three months. The three-month moving average has turned negative. Weakness in the industrial economy is now spreading and deepening. The consumer sector is leading the weakness. Consumer durable [...]
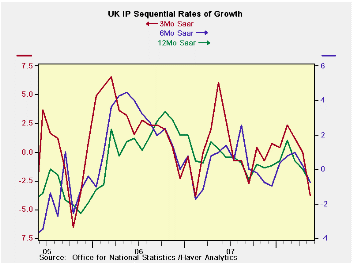
UK IP is now lower in two of the past three months. The three-month moving average has turned negative. Weakness in the industrial economy is now spreading and deepening. The consumer sector is leading the weakness. Consumer durable goods output is down in seven of the last eight months on a Yr/Yr basis. Consumer nondurables are down yr/yr in six of the last eight months but also in eight of the last 10 months (Yr/Yr basis as well). Intermediate goods output is off in two of the past three-months Yr/Yr. While capital goods output has fallen in May on a Yr/Yr basis for the first time since December 2005.
The declines in output the current quarter (2008-Q2) are severe. For MFG the drop is -1.8% at an annual rate. Consumer durable goods output is off at a 9.4% pace in the quarter. Nondurables output is off at a 2.9% pace. Intermediate goods output is falling at a 3.3% pace. Capital goods output is rising at a 2.0% pace.
The UK is showing both inflation pressures and economic weakness. The weakness in the UK is more severe than what Europe has showed, at least as a whole. Still, the UK like Europe continues to show capital goods as the strongest sector. In this month’s report that strength is clearly on the decline.
| UK IP and MFG | ||||||||||
|---|---|---|---|---|---|---|---|---|---|---|
| Saar except m/m | Mo/Mo | May 08 |
Apr 08 |
May 08 |
Apr 08 |
May 08 |
Apr 08 |
|||
| UK MFG | May 08 |
Apr 08 |
Mar 08 |
3Mo | 3Mo | 6mo | 6mo | 12mo | 12mo | Q1 Date |
| MFG | -0.6% | 0.1% | -0.5% | -3.8% | 0.0% | -0.8% | 0.2% | -0.8% | 0.0% | -1.8% |
| Consumer | ||||||||||
| Consumer Durables | -0.1% | -0.6% | -2.9% | -13.5% | -7.4% | 1.6% | -1.2% | -1.2% | -3.5% | -9.4% |
| Consumer-Nondurables | -0.8% | -0.1% | -0.4% | -5.1% | 0.0% | -2.0% | 0.2% | -1.7% | -0.4% | -2.9% |
| Intermediate | -1.0% | 0.1% | -0.5% | -5.4% | -1.3% | -3.8% | -2.7% | -2.3% | 0.3% | -3.3% |
| Capital | -0.7% | 0.7% | 0.0% | 0.0% | 3.7% | 1.1% | 0.7% | -0.1% | 0.8% | 2.0% |
| Memo: Detail | 1Mo% | 1Mo% | 1Mo% | 3Mo | 3Mo | 6mo | 6mo | 12mo | 12mo | Q4 Date |
| Food Drink & tobacco | -0.3% | -0.4% | -0.4% | -4.3% | -0.4% | -1.0% | 0.4% | -1.4% | -1.7% | -2.8% |
| Textile & Leather | -0.3% | 0.1% | 0.3% | 0.5% | 6.5% | 4.4% | 1.8% | 0.6% | 3.6% | 2.6% |
| Motor Vehicles & trailer | -3.7% | 1.9% | -1.0% | -11.0% | 11.4% | 2.9% | 5.1% | 5.1% | 9.4% | -0.3% |
| Mining and Quarry | 0.7% | -0.1% | 0.3% | 3.4% | -3.3% | -5.8% | -12.2% | -7.0% | -5.7% | 0.3% |
| Electricity, Gas & Water | -5.2% | 1.3% | -1.0% | -18.2% | 3.7% | -10.3% | -1.2% | -3.7% | 7.3% | -8.2% |

Robert Brusca
AuthorMore in Author Profile »Robert A. Brusca is Chief Economist of Fact and Opinion Economics, a consulting firm he founded in Manhattan. He has been an economist on Wall Street for over 25 years. He has visited central banking and large institutional clients in over 30 countries in his career as an economist. Mr. Brusca was a Divisional Research Chief at the Federal Reserve Bank of NY (Chief of the International Financial markets Division), a Fed Watcher at Irving Trust and Chief Economist at Nikko Securities International. He is widely quoted and appears in various media. Mr. Brusca holds an MA and Ph.D. in economics from Michigan State University and a BA in Economics from the University of Michigan. His research pursues his strong interests in non aligned policy economics as well as international economics. FAO Economics’ research targets investors to assist them in making better investment decisions in stocks, bonds and in a variety of international assets. The company does not manage money and has no conflicts in giving economic advice.
More Economy in Brief


