 Global| Mar 24 2009
UK Inflation Accelerates
Summary
UK inflation spurted in February quite unexpectedly. As the table shows, the month-to-month acceleration is quite widespread. UK core inflation continues to hover below the key 2% level, although it has ticked up this month too. [...]
UK inflation spurted in February quite unexpectedly. As the
table shows, the month-to-month acceleration is quite widespread. UK
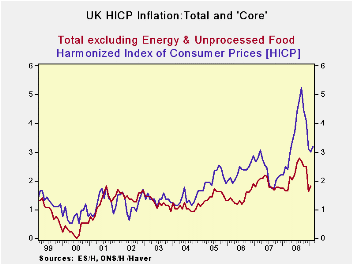
core inflation continues to hover below the key 2% level, although it
has ticked up this month too. Headline inflation has ticked higher and
now stands at 3.2% Yr/Yr. Three-and six-month headline inflation show a
sharp deceleration as you can tell from the included chart. UK
statistics have been a bit mercurial with surveys showing much more
weakness that the actual reports especially for things like retail
sales. It is certainly too soon to develop angst over inflation trends
in the UK. For the moment the month’s report is a curiosity. Surely
economic conditions are still too weak to engender any significant
inflation at this time. Still, Europe is the place that inflation is
most feared. The BOE has been bolder than the ECB and ECB policies
remain more restrictive than in the UK. Even so, having an inflation
scare in a country so close to home, even a scare of minor proportions,
is an issue. It is not the sort of thing that will get the kind of bold
action from the ECB that the European economies still seem to need. The
UK inflation blip is not good news.
| UK HICP and RPI Inflation | |||||||
|---|---|---|---|---|---|---|---|
| % MO/MO | % saar | ||||||
| Feb-09 | Jan-09 | Dec-08 | 3-MO | 6-MO | 12-MO | Yr Ago | |
| HICP | 0.7% | -0.1% | -0.5% | 0.4% | 0.7% | 3.2% | 2.5% |
| All Item RPI | 0.3% | -0.7% | -1.5% | -7.4% | -4.7% | 0.0% | 4.1% |
| RPI x | 0.7% | -0.1% | -0.6% | 0.0% | -0.3% | 2.6% | 3.6% |
| RPI excl Seasonal Food | 0.3% | -0.7% | -1.5% | -7.7% | -4.9% | -0.3% | 4.1% |
| Food & Beverages | 1.6% | 0.1% | 0.5% | 9.1% | 6.1% | 11.3% | 6.1% |
| Housing and HH Expenditures | -0.5% | -0.9% | -3.2% | -17.1% | -8.5% | -2.7% | 5.1% |
| Clothing & Footwear | 0.8% | -0.1% | -3.2% | -9.6% | -8.2% | -6.4% | -1.5% |
| Leisure Services | 0.4% | 0.4% | 0.2% | 4.2% | 4.7% | 5.3% | 3.1% |
| Leisure Goods | 1.5% | -0.1% | -1.9% | -1.9% | -3.6% | -3.6% | -2.7% |
| Motoring Expenditures | 1.9% | -1.9% | -2.3% | -9.1% | -16.7% | -7.4% | 5.2% |
| Fares and Travel Costs | -1.5% | -3.2% | 4.8% | -0.4% | 2.8% | 8.3% | 3.8% |
| A RED highlight indicates inflation accelerating from pace of previous horizon | |||||||

Robert Brusca
AuthorMore in Author Profile »Robert A. Brusca is Chief Economist of Fact and Opinion Economics, a consulting firm he founded in Manhattan. He has been an economist on Wall Street for over 25 years. He has visited central banking and large institutional clients in over 30 countries in his career as an economist. Mr. Brusca was a Divisional Research Chief at the Federal Reserve Bank of NY (Chief of the International Financial markets Division), a Fed Watcher at Irving Trust and Chief Economist at Nikko Securities International. He is widely quoted and appears in various media. Mr. Brusca holds an MA and Ph.D. in economics from Michigan State University and a BA in Economics from the University of Michigan. His research pursues his strong interests in non aligned policy economics as well as international economics. FAO Economics’ research targets investors to assist them in making better investment decisions in stocks, bonds and in a variety of international assets. The company does not manage money and has no conflicts in giving economic advice.
More Economy in Brief


