 Global| Sep 24 2004
UK "Engineering" Orders Gain in July; Home Market More Stable than Export Demand
Summary
Capital goods orders in the UK, that is, in the "engineering" sector, were reported today for July. Total new orders were up 1.1% in the month, with orders on hand (i.e., the order "backlog" or "book") rising 0.3%. (See the first [...]
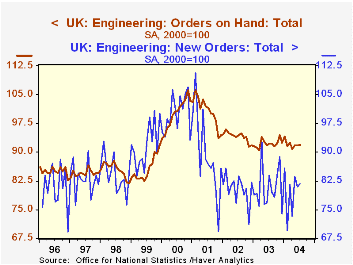
Capital goods orders in the UK, that is, in the "engineering" sector, were reported today for July. Total new orders were up 1.1% in the month, with orders on hand (i.e., the order "backlog" or "book") rising 0.3%. (See the first graph.) Through their wide month-to-month swings, new orders appear to be forming a bottoming pattern, perhaps a precursor to some strengthening ahead.
The UK's Office for National Statistics (ONS) gives two breakdowns of these orders. Industries are shown in two broad groupings, materials and equipment and electrical and optical equipment. New orders in the former division, with a July index level of 105.4, have hovered near the 2000 base level since the origin of these data in 1996. The other category, electrical, has shown more cyclicality. New orders there were at 71.3 in July, still nearly 29% below their average in the year 2000. Obviously, Britain's high tech sector has not yet recovered from its post-Y2K decline.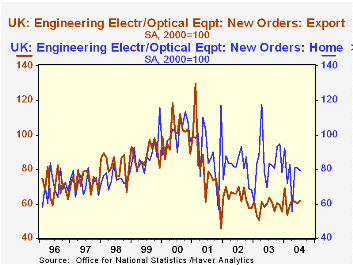
The ONS also tells us the origin of these orders, whether they come from domestic or foreign customers. Unlike Germany, whose industrial orders we discussed here a couple of weeks ago, in the UK, domestic orders are running firmer than foreign demand. This is particularly the case for the electrical/optical sector. Both domestic and foreign orders have sagged from their peaks in 2000, but new orders for export have fallen to just 60% of their 2000 volume while domestic orders are about 80%. (See second graph.) This hardly says that domestic orders are "strong" by pre-2000 standards, but they fell less during the downturn and bottomed sooner -- a 12-month moving average stopped falling in September 2002 -- than foreign orders, of which a 12-month average continued to decline until mid-2003.
| Index, 2000=100, SA | July 2004 | June 2004 | May 2004 | July 2003 | 2003 | 2002 | 2001 |
|---|---|---|---|---|---|---|---|
| Total New Orders | 81.8 | 80.9 | 83.5 | -2.5 | 0.4 | -10.2 | -10.5 |
| Home (Domestic) | 88.9 | 88.3 | 89.4 | -2.2 | 4.5 | -7.6 | -5.5 |
| Foreign (Export) | 72.4 | 70.9 | 75.6 | -2.7 | -6.3 | -14.1 | -17.1 |
| Ratio: Foreign/Home: Total | 0.81 | 0.80 | 0.86 | 0.82 | 0.74 | 0.82 | 0.89 |
| Machinery & Equipment | 0.95 | 0.97 | 1.09 | 1.00 | 0.88 | 0.94 | 0.91 |
| Electrical & Optical Equip | 0.78 | 0.75 | 0.76 | 0.76 | 0.71 | 0.79 | 0.91 |
Carol Stone, CBE
AuthorMore in Author Profile »Carol Stone, CBE came to Haver Analytics in 2003 following more than 35 years as a financial market economist at major Wall Street financial institutions, most especially Merrill Lynch and Nomura Securities. She had broad experience in analysis and forecasting of flow-of-funds accounts, the federal budget and Federal Reserve operations. At Nomura Securities, among other duties, she developed various indicator forecasting tools and edited a daily global publication produced in London and New York for readers in Tokyo. At Haver Analytics, Carol was a member of the Research Department, aiding database managers with research and documentation efforts, as well as posting commentary on select economic reports. In addition, she conducted Ways-of-the-World, a blog on economic issues for an Episcopal-Church-affiliated website, The Geranium Farm. During her career, Carol served as an officer of the Money Marketeers and the Downtown Economists Club. She had a PhD from NYU's Stern School of Business. She lived in Brooklyn, New York, and had a weekend home on Long Island.
More Economy in Brief


