 Global| Jun 04 2009
U.S. Worker Productivity Increase Stronger, But Underlying Cost Pressures Mount
by:Tom Moeller
|in:Economy in Brief
Summary
Labor productivity in the nonfarm business sector was revised higher for last quarter to 1.5% (AR) from the initial estimate of a 0.8% increase. The Consensus expectation was for revision to 1.2% growth. (Earlier figures also were [...]
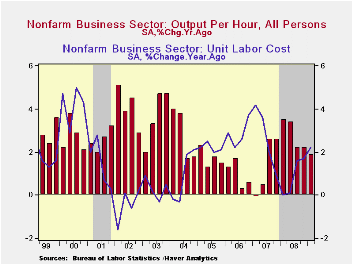
Labor productivity in the nonfarm business sector was revised higher for last quarter to 1.5% (AR) from the initial estimate of a 0.8% increase. The Consensus expectation was for revision to 1.2% growth. (Earlier figures also were revised slightly.) Productivity growth has weakened sharply with the current economic downturn. During the last nine months productivity has risen just 0.8% which is the weakest performance since early-2007. Nevertheless, any positive growth during a recessionary period contrasts with the declines in during the downturns of the 1950s through the 1980s.
Though productivity growth has slowed dramatically, businesses were quick in responding to the output shortfall by cutting employment and hours-worked. Output fell at a 7.6% annual rate last quarter after falling 8.8% during 4Q '08. These declines marked the quickest back-to-back since early 1958. However, businesses responded quickly by cutting employment & hours worked at a 9.0% rate last quarter and by 8.3% during 4Q.
The drop in productivity growth has hurt corporations' bottom
lines due to the fact that growth in compensation costs has remained
firm. It rose an upwardly revised 4.6% last quarter and that left y/y
growth at 4.1%. Annually, growth in compensation has been roughly
stable near the 4% level since 2001.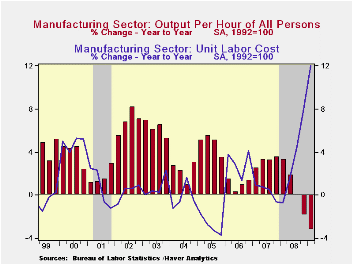
The combination of recently diminished productivity growth and stable, firm gains in compensation has increased costs. However, for last quarter growth in unit labor costs was revised down slightly to 3.0% following the 5.1% jump during 4Q. The increases raised the six-month growth in costs to a downwardly revised 4.0% versus just 0.9% during all of last year.
In the factory sector, the pressure on corporations' bottom lines has been more intense. Worker productivity was revised up slightly but it still fell 2.7% during 1Q (-3.2% y/y), down for the fourth consecutive quarter. Year-to-year, the drop in productivity came as output fell faster (-13.9%) than hours worked (-11.0%). That decline in productivity growth has outpaced firms' ability to cut compensation costs. In fact, there's been no cut at all. Compensation growth of 13.4% last quarter lifted the y/y gain to 8.4%, nearly double last year's 4.1% advance. As a result, unit labor cost growth in the factory sector surged again. The 1Q increase of 16.6% lifted the annual gain to 12.0% which compares to just a 3.2% gain during all of last year.
The productivity & cost figures are available in Haver's USECON database.
Today's remarks at the Federal Reserve Board Conference on Financial Markets and Monetary Policy by Fed Chairman Ben S. Bernanke are available here.
| Nonfarm Business Sector (SAAR, %) | 1Q '09 (Revised) | 4Q '08 | Y/Y | 2008 | 2007 | 2006 |
|---|---|---|---|---|---|---|
| Output per Hour | 1.6 | -0.6 | 1.9 | 2.8 | 1.4 | 0.9 |
| Compensation per Hour | 4.6 | 4.5 | 4.1 | 3.7 | 4.1 | 3.8 |
| Unit Labor Costs | 3.0 | 5.1 | 2.2 | 0.9 | 2.7 | 2.8 |
by Tom Moeller June 4, 2009
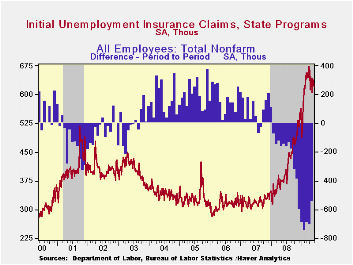
The labor market is neither worsening nor improving significantly. It just remains quite soft. The latest indication of this is last week's slip in initial claims for unemployment insurance by 4,000 to 621,000 from an upwardly revised level of 625,000. Initial claims are down from their March peak of 674,000. However, the four-week average of claims, which smoothes out some of the volatility in the weekly numbers, rose slightly to 631,250. Though that was near the lowest level since mid-February it was up by two-thirds from the year ago level. The Consensus expectation was for 620,000 claims last week.
The Labor Department indicated that the largest increases in initial claims for the week ending May 23 were in Illinois (+3,881), Iowa (+2,312), South Carolina (+1,792), Texas (+1,548), and Wisconsin (+1,464), while the largest decreases were in North Carolina (-3,952), Michigan (-2,812), Ohio (-2,158), Tennessee (-2,053), and Connecticut (-1,320).
Continuing claims for unemployment insurance, which provide an
indication of workers' ability to find employment remained near the
record high of 6,735,000, more than twice the year ago level.
Further indicating that the job market remains weak, the
four-week average of continuing claims also rose to another record of
6,687,500. The series dates back to 1966.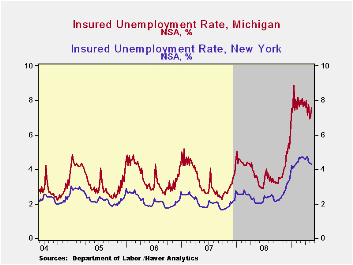
Another indication of the labor market's softness was that the insured unemployment rate held at 5.0% for the third consecutive week. That level was more than double last May and the highest level since 1983. During the last ten years there has been a 93% correlation between the level of the insured unemployment rate and the overall rate of unemployment published by the Bureau of Labor Statistics.Clearly, the latest weekly figure understates labor market distress in some states.
The highest insured unemployment rates in the week ending May 16 were in Michigan (7.6 percent), Oregon (7.1), Puerto Rico (6.7), Nevada (6.4), Pennsylvania (6.2), Wisconsin (5.9), California (5.5), Arkansas (5.4), Idaho (5.4), and North Carolina (5.4). Even in states where the insured unemployment rate was relatively low such as Massachusetts (5.0), New York (4.3), Florida (3.9) Georgia (3.7), Texas (2.9), and Virginia (2.6), the level was double that of one year ago.
The unemployment insurance claims data is available in Haver's WEEKLY database and the state data is in the REGIONW database.
Yesterday's testimony by Fed Chairman Ben S. Bernanke can be found here.
| Unemployment Insurance (000s) | 05/30/09 | 05/23/09 | 05/16/09 | Y/Y | 2008 | 2007 | 2006 |
|---|---|---|---|---|---|---|---|
| Initial Claims | 621 | 625 | 636 | 67.8% | 420 | 321 | 313 |
| Continuing Claims | -- | 6,735 | 6,750 | 117.6% | 3,342 | 2,552 | 2,459 |
by Robert Brusca June 4, 2009
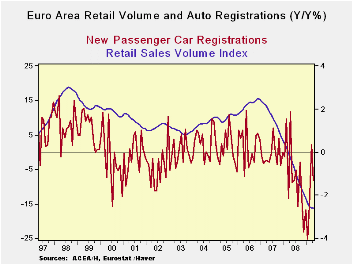
EMU area retail sales volume is still eroding but at a slow
pace. The volume drop in the past three months was just 0.2% per month
Retail sales have been declining in the Area but have not been as weak
as in the US. Passenger car registrations in Europe have begun to take
off as several nations’ scrappage plans have encouraged consumers to
buy new vehicles.
Europe’s consumers still face hurdles. Unemployment is rising
and is still probably in is early sages of increasing; France reported
a surge in unemployment in Q1 just today as its rate jumped to 9.1%
from 8% in Q4. Spain’s rate has climbed up over 18% to nearly 19%.
Consumer confidence is low throughout the Area, although it has been
edging up. Income preservation polices have helped consumers to hold
the line on spending. Sensitive cyclical surveys in the form of
purchaser indices show that MFG and Service sectors are coming up from
their lows. With these positive pulses in train any further damage to
consumption from rising unemployment could be limited.
| Euro Area Retail Sales Volume | ||||||
|---|---|---|---|---|---|---|
| M/M | Saar | |||||
| Apr-09 | Mar-09 | Feb-09 | 3-Mo | 6-MO | 12-Mo | |
| Zone Total | -0.2% | -0.2% | -0.2% | -2.5% | -2.9% | -2.6% |
| Food, Beverage, and Tobacco | -0.1% | -0.1% | -0.2% | -1.8% | -2.1% | -2.1% |
| Motor Vehicle Reg | 5.9% | -1.7% | 20.4% | 146.8% | 8.4% | -8.1% |
| Non-Food Country detail: Volume | ||||||
| Germany | 0.5% | -0.4% | 0.0% | 0.4% | -1.5% | -0.3% |
| UK (EU) | 0.9% | 1.2% | -2.1% | -0.4% | 3.9% | 2.7% |

Tom Moeller
AuthorMore in Author Profile »Prior to joining Haver Analytics in 2000, Mr. Moeller worked as the Economist at Chancellor Capital Management from 1985 to 1999. There, he developed comprehensive economic forecasts and interpreted economic data for equity and fixed income portfolio managers. Also at Chancellor, Mr. Moeller worked as an equity analyst and was responsible for researching and rating companies in the economically sensitive automobile and housing industries for investment in Chancellor’s equity portfolio. Prior to joining Chancellor, Mr. Moeller was an Economist at Citibank from 1979 to 1984. He also analyzed pricing behavior in the metals industry for the Council on Wage and Price Stability in Washington, D.C. In 1999, Mr. Moeller received the award for most accurate forecast from the Forecasters' Club of New York. From 1990 to 1992 he was President of the New York Association for Business Economists. Mr. Moeller earned an M.B.A. in Finance from Fordham University, where he graduated in 1987. He holds a Bachelor of Arts in Economics from George Washington University.
More Economy in Brief


