 Global| Aug 19 2009
U.S. Weekly Mortgage ApplicationsRise But Trend Remains Weak
by:Tom Moeller
|in:Economy in Brief
Summary
The Mortgage Bankers Association indicated that mortgage applications overall increased 5.6% last week; however, that only made up for a 3.5% decline during the prior period. Together, the latest figures left applications for all of [...]
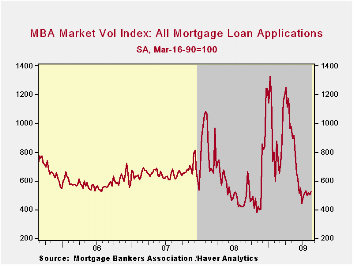 The Mortgage
Bankers Association indicated that mortgage applications overall
increased 5.6% last week; however, that only made up for a 3.5% decline
during the prior period. Together, the latest figures left applications
for all of August up 0.6% from July after that month's 3.7% decline.
Applications still remained near the lowest level since last November.
The Mortgage
Bankers Association indicated that mortgage applications overall
increased 5.6% last week; however, that only made up for a 3.5% decline
during the prior period. Together, the latest figures left applications
for all of August up 0.6% from July after that month's 3.7% decline.
Applications still remained near the lowest level since last November.
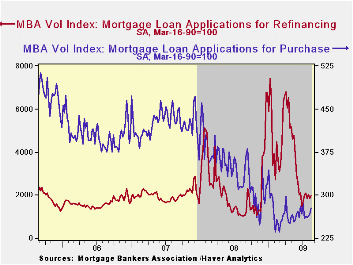
There has been some life in purchase applications, but it's hardly vibrant. Applications rose 3.9% last week after a 1.1% increase during the prior period. Together the gains lifted applications for the month so far by 2.2% from July when applications fell 1.3% m/m. Nevertheless since the early-February low, purchase applications have risen 15% as new and existing home sales have recovered.
 During the last ten years
there has been a (negative) 79% correlation between the level of
applications for purchase and the effective interest rate on a 30-year
mortgage. Moreover, during the last ten years there has been
a 61% correlation between the y/y change in purchase applications and
the change in new plus existing single family home sales.
During the last ten years
there has been a (negative) 79% correlation between the level of
applications for purchase and the effective interest rate on a 30-year
mortgage. Moreover, during the last ten years there has been
a 61% correlation between the y/y change in purchase applications and
the change in new plus existing single family home sales.
Interest in mortgage refinancing has been stifled of late by the rise in interest rates. Applications to refinance made up merely the prior week's decline with a 6.9% increase. So far in August, applications are 0.8% lower than July and near the lowest level since November. Since their peak in January, refinance applications have fallen by three-quarters.
Since the beginning of this year, fixed-rate mortgage applications have fallen by slightly more than one-half while adjustable-rate mortgages have doubled. The number of conventional loans has fallen nearly two-thirds while gov't backed loans have fallen by more than one-third.
The earlier rise in mortgage interest rates
has stabilized, for the moment. 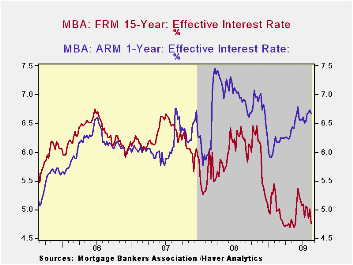 The effective interest rate on a
conventional 15-year mortgage fell last week to 4.76% and for the month
averaged 4.89%. These figures are up from the April low of 4.69% but
the rate had reached a high of 5.36% in early-June. For a 30-year
mortgage, the rate also fell last week to 5.35% after reaching a high
of 5.79% in early-June.<
Interest rates on 15- and 30-year mortgages are
closely correlated (>90%) with the rate on 10-year Treasury
securities. Rates on adjustable 1-Year mortgages averaged 6.71% this
month versus the low near 6.0% during January. Nevertheless, the rate
remained down from the 7.07% peak reached last
fall.
The effective interest rate on a
conventional 15-year mortgage fell last week to 4.76% and for the month
averaged 4.89%. These figures are up from the April low of 4.69% but
the rate had reached a high of 5.36% in early-June. For a 30-year
mortgage, the rate also fell last week to 5.35% after reaching a high
of 5.79% in early-June.<
Interest rates on 15- and 30-year mortgages are
closely correlated (>90%) with the rate on 10-year Treasury
securities. Rates on adjustable 1-Year mortgages averaged 6.71% this
month versus the low near 6.0% during January. Nevertheless, the rate
remained down from the 7.07% peak reached last
fall.
The Mortgage Bankers Association surveys between 20 to 35 of the top lenders in the U.S. housing industry to derive its refinance, purchase and market indexes. The weekly survey covers roughly 50% of all U.S. residential mortgage applications processed each week by mortgage banks, commercial banks and thrifts. Visit the Mortgage Bankers Association site here. The figures for weekly mortgage applications are available in Haver's SURVEYW database.
Sustaining a Global Recovery from the International Monetary Fund can be found here.
| MBA Mortgage Applications (3/16/90=100) | 08/14/09 | 08/07/09 | Y/Y | 2008 | 2007 | 2006 |
|---|---|---|---|---|---|---|
| Total Market Index | 527.0 | 499.0 | 25.7% | 642.9 | 652.6 | 584.2 |
| Purchase | 277.7 | 267.2 | -11.6% | 345.4 | 424.9 | 406.9 |
| Refinancing | 1,982.5 | 1,853.8 | 91.6% | 2,394.1 | 1,997.9 | 1,634.0 |
by Tom Moeller August 19, 2009
 Encouraging
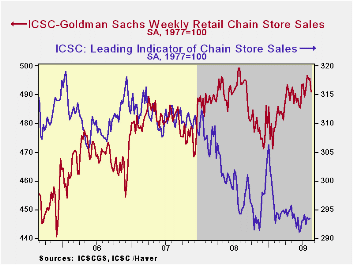
indications that consumer spending was improving faded during August.
During the latest week, chain store sales fell 0.9% and that was enough
to leave the August average unchanged from July after that month's 1.0%
increase from June.
Encouraging
indications that consumer spending was improving faded during August.
During the latest week, chain store sales fell 0.9% and that was enough
to leave the August average unchanged from July after that month's 1.0%
increase from June.
During the last ten years there has been a 69%
correlation between the year-to-year growth in chain store sales and
the growth in general merchandise sales. The weekly figures
are available in Haver's SURVEYW database.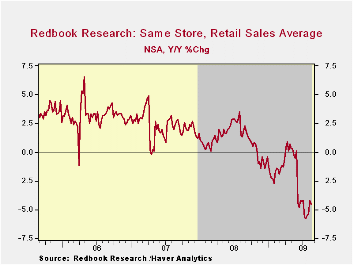
The ICSC-Goldman Sachs retail chain-store sales index is constructed using the same-store sales (stores open for one year) reported by 78 stores of seven retailers: Dayton Hudson, Federated, Kmart, May, J.C. Penney, Sears and Wal-Mart.
Prospects for improvement in sales seem limited. The leading indicator of sales ticked up 0.1% (-0.3% y/y) during the latest week and it has been flat all this year.
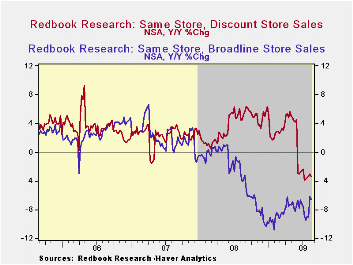 The
Johnson Redbook also reported soft sales of late. General
merchandise store sales so far this month slipped a seasonally adjusted
0.6% from July (-4.4% y/y). Department store sales were down 6.6% y/y
on a same-store basis while discount store sales fell a lesser 3.4% as
shoppers searched for bargains.
The
Johnson Redbook also reported soft sales of late. General
merchandise store sales so far this month slipped a seasonally adjusted
0.6% from July (-4.4% y/y). Department store sales were down 6.6% y/y
on a same-store basis while discount store sales fell a lesser 3.4% as
shoppers searched for bargains.
Excluding Items from Personal Consumption Expenditures Inflation from the Federal Reserve Bank of Dallas is available here.
| ICSC-UBS (SA, 1977=100) | 08/14/09 | 08/07/09 | Y/Y | 2008 | 2007 | 2006 |
|---|---|---|---|---|---|---|
| Total Weekly Chain Store Sales | 491.0 | 495.6 | -0.6% | 1.4% | 2.8% | 3.3% |
by Tom Moeller August 19, 2009
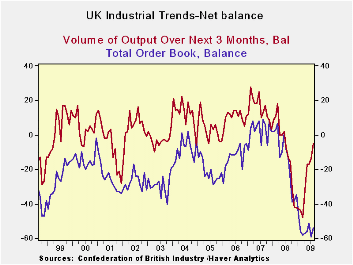
The Confederation of British Industry continues to see very
weak orders in both its domestic and export surveys. Both total and
export orders are in the lower ten percentile of their historic range
of values. Stocks of goods with a diffusion reading that fell to +13
from +20 are now near their range mid range (standing at their 45th
percentile) and are well below their 12-monhth average, showing
inventory progress has been made. In contrast orders are weaker than
their 12-month averages. What ever is getting better it does not seem
to be boosting orders despite the gain in August.
To compare with that finding we have the contrary result that
although orders are very weak output volume over the next three months
is expected to do much better. The survey measure rose to -5 in August
from -14 in July, thrusting output volume expectations into the 57th
percentile of their range, far better than the reading for orders. The
average price expected has however slipped in August to -17 from -6 in
June. That is on the lower 6 percentile of its range. These readings
contrast with the UK MFG readings from NTC which at 50.84 is indicating
expansion and stands in the 74th percentile of its range. (The NTC
survey is also a diffusion survey but it presents its statistics as
dose the US ISM rather than as an ‘up’ minus ‘down’ diffusion index as
the one used by the CBI. For the CBI, zero is neutral; for the NTC
index, 50 is the neutral mark. Also the NTC index is for manufacturing
not all of industry, as is the CBI report.)
The outlook portion of the CBI index is relatively more
positive, but still is not as upbeat as the Markit/NTC index. And the
orders assessment from the CBI is downright depressing as its
improvement in July still leaves the index lower over three months and
longer. The picture of the UK MFG industry is curiously mixed. The
differences are not simply those between different surveys but among
somewhat related measures in the same survey.
| UK Industrial volume data CBI Survey | ||||||||||
|---|---|---|---|---|---|---|---|---|---|---|
| Reported: | Aug 09 |
Jul 09 |
Jun 09 |
May 09 |
Apr 09 |
12MO Avg | Pcntle | Max | Min | Range |
| Total Orders | -54 | -59 | -51 | -56 | -57 | -43 | 7% | 9 | -59 | 68 |
| Export Orders | -48 | -45 | -52 | -46 | -34 | -36 | 7% | 3 | -52 | 55 |
| Stocks: FinGds | 13 | 20 | 22 | 30 | 28 | 25 | 45% | 31 | -2 | 33 |
| Looking ahead | ||||||||||
| Output Volume: Nxt 3M | -5 | -14 | -17 | -17 | -32 | -31 | 57% | 28 | -48 | 76 |
| Avg Prices 4Nxt 3m | -17 | -6 | -13 | -20 | -10 | -1 | 6% | 34 | -20 | 54 |
| From end 2000 | ||||||||||
| Compare to NTC MFG | ||||||||||
| Jul 09 |
Jun 09 |
May 09 |
Apr 09 |
12MO Avg | Pcntle | Max | Min | Range | ||
| UK MFG | 50.84 | 47.36 | 45.40 | 43.13 | 41.22 | 74% | 56.32 | 34.93 | 21 | |

Tom Moeller
AuthorMore in Author Profile »Prior to joining Haver Analytics in 2000, Mr. Moeller worked as the Economist at Chancellor Capital Management from 1985 to 1999. There, he developed comprehensive economic forecasts and interpreted economic data for equity and fixed income portfolio managers. Also at Chancellor, Mr. Moeller worked as an equity analyst and was responsible for researching and rating companies in the economically sensitive automobile and housing industries for investment in Chancellor’s equity portfolio. Prior to joining Chancellor, Mr. Moeller was an Economist at Citibank from 1979 to 1984. He also analyzed pricing behavior in the metals industry for the Council on Wage and Price Stability in Washington, D.C. In 1999, Mr. Moeller received the award for most accurate forecast from the Forecasters' Club of New York. From 1990 to 1992 he was President of the New York Association for Business Economists. Mr. Moeller earned an M.B.A. in Finance from Fordham University, where he graduated in 1987. He holds a Bachelor of Arts in Economics from George Washington University.
More Economy in Brief


