 Global| Dec 10 2009
U.S. Weekly Initial Claims ForUnemployment Insurance Retrace Prior Declines
by:Tom Moeller
|in:Economy in Brief
Summary
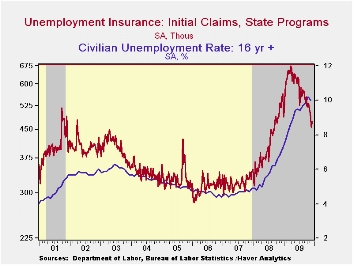
The Labor Department indicated that recent job market improvement stalled last week as suggested by a moderate rise in initial claims for unemployment insurance. The rise to 474,000 from an unrevised 457,000 retraced much of the prior [...]
 The Labor
Department indicated that recent job market improvement stalled last
week as suggested by a moderate rise in initial claims for unemployment
insurance. The rise to 474,000 from an unrevised 457,000 retraced much
of the prior two weeks' decline. Nevertheless, claims remained near the
15-month low, down from the recession peak of 674,000 claims reached in
March. The four-week moving average of claims fell to 473,750 and the
latest weekly figure was higher than Consensus expectations for an
increase to 460,000 claims.
The Labor
Department indicated that recent job market improvement stalled last
week as suggested by a moderate rise in initial claims for unemployment
insurance. The rise to 474,000 from an unrevised 457,000 retraced much
of the prior two weeks' decline. Nevertheless, claims remained near the
15-month low, down from the recession peak of 674,000 claims reached in
March. The four-week moving average of claims fell to 473,750 and the
latest weekly figure was higher than Consensus expectations for an
increase to 460,000 claims.
 Continuing claims for unemployment
insurance during the latest week fell a sharp 303,000 after a
little-revised 24,000 increase during the week prior. Continuing claims
were at the lowest level since late-February. The decline is a function
of the improved job market but also reflects the exhaustion of
unemployment benefits. Continuing claims provide an indication of
workers' ability to find employment. The four-week average of
continuing claims fell to 5,416,500. This series dates back to
1966.
Continuing claims for unemployment
insurance during the latest week fell a sharp 303,000 after a
little-revised 24,000 increase during the week prior. Continuing claims
were at the lowest level since late-February. The decline is a function
of the improved job market but also reflects the exhaustion of
unemployment benefits. Continuing claims provide an indication of
workers' ability to find employment. The four-week average of
continuing claims fell to 5,416,500. This series dates back to
1966.
 Extended
benefits for unemployment insurance
fell sharply w/w to 407,455 during the third week of November. The
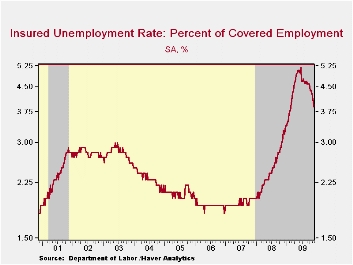
latest was versus 550,343 during all of October.· The insured rate of
unemployment fell t0 3.9%, the lowest level since February. The rate
reached a high of 5.2% during late-June. During the last ten years,
there has been a 93% correlation between the level of the insured
unemployment rate and the overall rate of unemployment published by the
Bureau of Labor Statistics.
Extended
benefits for unemployment insurance
fell sharply w/w to 407,455 during the third week of November. The
latest was versus 550,343 during all of October.· The insured rate of
unemployment fell t0 3.9%, the lowest level since February. The rate
reached a high of 5.2% during late-June. During the last ten years,
there has been a 93% correlation between the level of the insured
unemployment rate and the overall rate of unemployment published by the
Bureau of Labor Statistics.
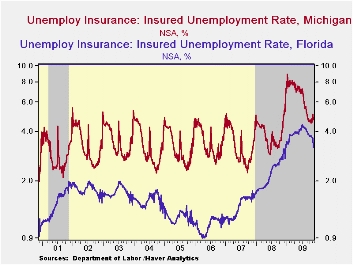
The highest insured unemployment rates in the week ending November 21 were in Puerto Rico (6.1%), Oregon (5.6), Alaska (5.5), Nevada (5.1), Wisconsin (4.9), Pennsylvania (4.8), Michigan (4.7), California (4.4) and South Carolina (4.3). The lowest insured unemployment rates were in North Dakota (1.3%), Virginia (1.9), Texas (2.4), Wyoming (2.8), Maine (2.9), Maryland (3.1), Ohio (3.3), Mississippi (3.4), New York (3.5), and Florida (3.2). The data are not seasonally adjusted but the overall insured unemployment rate is.
The unemployment insurance claims data is available in Haver's WEEKLY database and the state data is in the REGIONW database.
| Unemployment Insurance (000s) | 12/05/09 | 11/28/09 | 11/21/09 | Y/Y | 2008 | 2007 | 2006 |
|---|---|---|---|---|---|---|---|
| Initial Claims | 474 | 457 | 463 | -14.1% | 420 | 321 | 313 |
| Continuing Claims | -- | 5,157 | 5,460 | 18.4% | 3,342 | 2,552 | 2,459 |
| Insured Unemployment Rate (%) | -- | 3.9 | 4.1 | 3.1 (11/2008) | 2.5 | 1.9 | 1.9 |
Foreign orders drive recovery
by Robert Brusca December 10, 2009
Machinery orders are a volatile measure almost by design.
Because of the lumpy nature and large scope of some projects it is hard
to get a reliable reading on this series. Looking at core orders is one
way to stabilize the signal. This measure excludes the most volatile
components of the order series. In October core orders fell, but that
was after rising by a sharp 10.5% in December. The sequential growth
rate of orders is on a strong upswing despite this month’s set back.
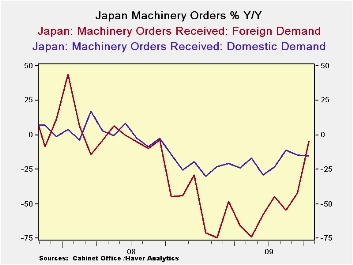
The overall orders measure that includes those large and lumpy
projects also is improving strongly. For once the trends of the two
series are in agreement even if the monthly numbers are going in
different directions.
The chart also shows domestic Vs foreign machinery orders.
While both series are showing some rise it is the foreign orders that
are doing most of the improvement. Japan like Germany is benefitting
more from demand outside of its country than from the domestic demand
within.
| Japan Machinery Orders | |||||||
|---|---|---|---|---|---|---|---|
| m/m % | Saar % | ||||||
| SA | Oct-09 | Sep-09 | Aug-09 | 3-Mos | 6-Mos | 12-Mos | 12-Mo Ago |
| Total | 3.2% | 6.0% | -1.9% | 32.7% | 43.3% | -12.3% | -27.4% |
| Core Orders* | -4.5% | 10.5% | 0.5% | 26.2% | 4.6% | -21.1% | -15.7% |
| Total Orders | |||||||
| Foreign Demand | 15.3% | 25.9% | -15.7% | 124.5% | 245.9% | -4.7% | -44.4% |
| Domestic demand | -3.0% | -5.4% | 7.1% | -7.1% | -4.6% | -15.3% | -14.1% |
| * Excl ships and electric power | |||||||
U.S. Trade Deficit Falls As Exports Jump
by Tom Moeller December 10, 2009
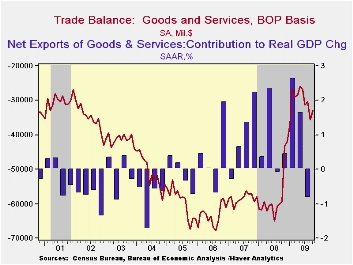 A
lower value of the dollar improves the competiveness of U.S. exports.
That undoubtedly was behind at least some of the decline in October's
trade deficit to $32.9B following a September deficit of $35.7, which
was revised lower from the initial estimate. Exports rose sharply,
their sixth month of increase despite economic weakness abroad, while
imports fell with a modest decline in oil prices. The latest figure was
quite a bit lower than Consensus expectations for a deficit of $37.0B.
A
lower value of the dollar improves the competiveness of U.S. exports.
That undoubtedly was behind at least some of the decline in October's
trade deficit to $32.9B following a September deficit of $35.7, which
was revised lower from the initial estimate. Exports rose sharply,
their sixth month of increase despite economic weakness abroad, while
imports fell with a modest decline in oil prices. The latest figure was
quite a bit lower than Consensus expectations for a deficit of $37.0B.
Reflecting the competitive value of the dollar, nominal exports rose 2.6% m/m and by 12.4% from the April low. Adjusted for price inflation, however, the gain is more impressive. Real merchandise exports during October rose 4.1% (-6.0% y/y), the third such increase in four months. A higher chained-dollar value of non-auto consumer goods exports led the increase with a 7.9% (3.5% y/y) surge after the 3.7% September jump. Real capital goods exports were not far behind and posted a 3.6% gain (-10.7% y/y) after a 5.2% September rise. Auto exports also were strong for the fifth straight month (-20.6% y/y). Exports of services rose for the fifth straight month (-5.6% y/y).
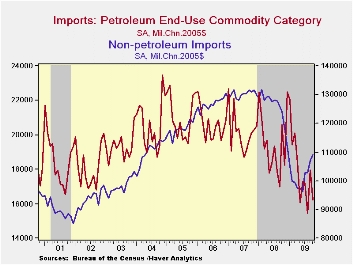
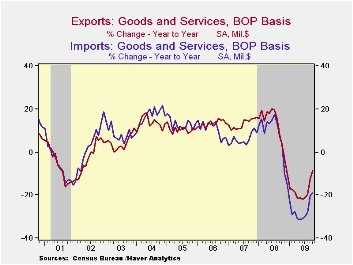 Overall
imports rose just 0.4%, the gain held back by
lower oil prices. Petroleum imports fell 9.7% m/m (-39.7% y/y) as the
average daily quantity imported fell 12.5% (-19.2% y/y). The dip in the
per barrel cost of crude petroleum to $67.39 helped the overall figure
to decline. Working the other way, U.S. economic recovery was apparent
in real nonoil imports which rose 2.2% during October for the third
increase in four months. These gains lessened the y/y decline to 11.9%
from its worst of 24.6%. Real non-auto capital goods imports jumped
3.5% (-13.0% y/y) after a 2.8% September rise. Real nonauto consumer
goods imports rose 2.6% and by 7.8% since June. These gains are
turnarounds from earlier sharp declines. Real automotive vehicles
& parts imports also jumped 1.9% (-7.4% y/y) in October, the
fifth consecutive month of gain. Finally, services imports rose a
modest 0.2% (-7.3% y/y) as U.S. travels abroad were discouraged by the
lower dollar. Travel imports fell 7.2% y/y and passenger fares fell
27.0%)
Overall
imports rose just 0.4%, the gain held back by
lower oil prices. Petroleum imports fell 9.7% m/m (-39.7% y/y) as the
average daily quantity imported fell 12.5% (-19.2% y/y). The dip in the
per barrel cost of crude petroleum to $67.39 helped the overall figure
to decline. Working the other way, U.S. economic recovery was apparent
in real nonoil imports which rose 2.2% during October for the third
increase in four months. These gains lessened the y/y decline to 11.9%
from its worst of 24.6%. Real non-auto capital goods imports jumped
3.5% (-13.0% y/y) after a 2.8% September rise. Real nonauto consumer
goods imports rose 2.6% and by 7.8% since June. These gains are
turnarounds from earlier sharp declines. Real automotive vehicles
& parts imports also jumped 1.9% (-7.4% y/y) in October, the
fifth consecutive month of gain. Finally, services imports rose a
modest 0.2% (-7.3% y/y) as U.S. travels abroad were discouraged by the
lower dollar. Travel imports fell 7.2% y/y and passenger fares fell
27.0%)
 By
country, the trade deficit with China fell to
$22.7B from $27.9B last October as exports rose 12.7% y/y and imports
fell 13.3%. With Japan, the trade deficit also narrowed sharply to
$4.4B from 6.1B one year earlier as the 21.0% decline in imports
outpaced the 13.0% decline in exports. With the European Union, the
trade deficit more than halved to $4.9B as imports fell 20.5% y/y which
was twice the decline in exports.
By
country, the trade deficit with China fell to
$22.7B from $27.9B last October as exports rose 12.7% y/y and imports
fell 13.3%. With Japan, the trade deficit also narrowed sharply to
$4.4B from 6.1B one year earlier as the 21.0% decline in imports
outpaced the 13.0% decline in exports. With the European Union, the
trade deficit more than halved to $4.9B as imports fell 20.5% y/y which
was twice the decline in exports.
The international trade data can be found in Haver's USECON database. Detailed figures are available in the USINT database.
| Foreign Trade | October | September | August | Y/Y | 2008 | 2007 | 2006 |
|---|---|---|---|---|---|---|---|
| U.S. Trade Deficit | $32.9 | $35.7B | $30.3B | $59.4B (10/08) | $695.9 | $701.4 | $760.4 |
| Exports - Goods & Services | 2.6% | 2.8% | 0.3% | -8.6% | 11.2% | 13.2% | 13.3% |
| Imports - Goods & Services | 0.4% | 5.6% | -0.5% | -18.8% | 7.6 | 6.0% | 10.8% |
| Petroleum | -10.4% | 20.7% | -5.4% | -41.0% | 37.0% | 9.4% | 20.1% |
| Nonpetroleum Goods | 2.9% | 4.2% | 0.3% | -15.2% | 1.5% | 4.8% | 9.1% |
by Tom Moeller December 10, 2009
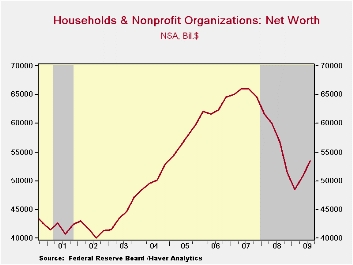
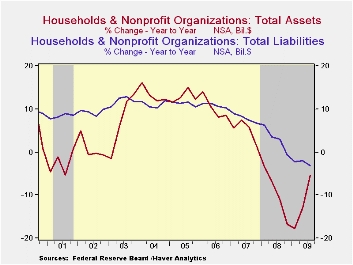 The
financial health of U.S. households continued to improve last quarter,
as indicated by the Federal Reserve's latest flow-of-funds figures.
Household net worth increased $2.7 trillion to $53.4 trillion after a
downwardly revised $2.3 trillion 2Q increase. Financial asset holdings
improved by $2.4 trillion as the stock market moved higher after a $1.9
trillion 2Q rise. Lower interest rates raised the value of Treasury
security holdings by $168 billion and tangible asset values
rose by $294 billion following the $391 billion 2Q rise. These gains
were helped, finally, by an improved value of real estate holdings.
Despite the gains, however, the value of households' real estate
holdings remained 27.9% below the late-2006 peak.
The
financial health of U.S. households continued to improve last quarter,
as indicated by the Federal Reserve's latest flow-of-funds figures.
Household net worth increased $2.7 trillion to $53.4 trillion after a
downwardly revised $2.3 trillion 2Q increase. Financial asset holdings
improved by $2.4 trillion as the stock market moved higher after a $1.9
trillion 2Q rise. Lower interest rates raised the value of Treasury
security holdings by $168 billion and tangible asset values
rose by $294 billion following the $391 billion 2Q rise. These gains
were helped, finally, by an improved value of real estate holdings.
Despite the gains, however, the value of households' real estate
holdings remained 27.9% below the late-2006 peak.
 Household
financial positions also improved due to the reduction of liabilities,
though that was small when compared to the rise in assets. Total
liabilities fell $12.0 billion. While the decline was the fifth in the
last six quarters, it paled versus recent $30-to-$300 quarterly
reductions. Mortgage debt reduction was the largest, down for the sixth
straight quarter, but consumer credit started to grow again along with
bank loans.
Household
financial positions also improved due to the reduction of liabilities,
though that was small when compared to the rise in assets. Total
liabilities fell $12.0 billion. While the decline was the fifth in the
last six quarters, it paled versus recent $30-to-$300 quarterly
reductions. Mortgage debt reduction was the largest, down for the sixth
straight quarter, but consumer credit started to grow again along with
bank loans.
| Flow of Funds (Y/Y % Chg.) | % of Total Outstanding | 3Q '09 | 2Q '09 | End of Year | ||
|---|---|---|---|---|---|---|
| 2008 | 2007 | 2006 | ||||
| Total Credit Market Debt Outstanding | -- | 1.1 | 2.9 | 5.0 | 10.4 | 9.8 |
| Federal Government | 13.6% | 30.1 | 35.9 | 24.2 | 4.9 | 3.9 |
| Households | 25.9% | -1.8 | -1.2 | 0.3 | 6.7 | 10.0 |
| Nonfinancial Corporate Business | 13.8% | 1.8 | 2.8 | 5.1 | 13.2 | 8.4 |
| Nonfarm, Noncorporate Business | 6.9% | -5.3 | -1.7 | 5.5 | 14.2 | 14.7 |
| Financial Sectors | 31.3% | -5.2 | -1.0 | 5.5 | 13.4 | 9.9 |
| Trillions of $ | ||||||
| Net Worth: Households & Nonprofit Organizations | -- | $53.423 | $50.757 | $51,379 | $64.507 | $64.520 |
| Tangible Assets: Households | -- | $23.069 | $22.775 | $23.891 | $28.036 | $29.735 |
| Financial Assets: Households | -- | $44.415 | $42.055 | $41.706 | $50.788 | $48.192 |
| Total Liabilities: Households | -- | $14.061 | $14.073 | $14.218 | $14.318 | $13.408 |

Tom Moeller
AuthorMore in Author Profile »Prior to joining Haver Analytics in 2000, Mr. Moeller worked as the Economist at Chancellor Capital Management from 1985 to 1999. There, he developed comprehensive economic forecasts and interpreted economic data for equity and fixed income portfolio managers. Also at Chancellor, Mr. Moeller worked as an equity analyst and was responsible for researching and rating companies in the economically sensitive automobile and housing industries for investment in Chancellor’s equity portfolio. Prior to joining Chancellor, Mr. Moeller was an Economist at Citibank from 1979 to 1984. He also analyzed pricing behavior in the metals industry for the Council on Wage and Price Stability in Washington, D.C. In 1999, Mr. Moeller received the award for most accurate forecast from the Forecasters' Club of New York. From 1990 to 1992 he was President of the New York Association for Business Economists. Mr. Moeller earned an M.B.A. in Finance from Fordham University, where he graduated in 1987. He holds a Bachelor of Arts in Economics from George Washington University.
More Economy in Brief


