 Global| Oct 23 2008
U.S. Weekly Initial Claims for Jobless Insurance Ticked Higher
by:Tom Moeller
|in:Economy in Brief
Summary
Initial claims for unemployment insurance rose 15,000 during last week to 448,000. That offset an 18,000 decline during the week prior which was revised slightly shallower.The Labor Department estimates that another 12,000 claims in [...]
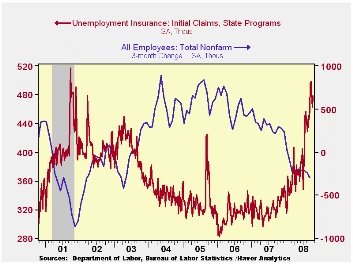
Initial claims for unemployment insurance rose 15,000 during last week to 448,000. That offset an 18,000 decline during the week prior which was revised slightly shallower.The Labor Department estimates that another 12,000 claims in the latest week were due to Hurricane Ike in Texas, the same as during the week prior but less than the 17,000 and 45,000 lifts during the two prior periods.
The four-week moving average of initial claims fell slightly to 480,250 (46.5% y/y), just barely off the cycle high.
The latest figures are for the survey week for October
non-farm payrolls and initial claims rose 20,000 (4.4%) from the
September period. During the last ten years there has been a 76%
inverse correlation between the level of initial claims and the m/m
change in non-farm payrolls.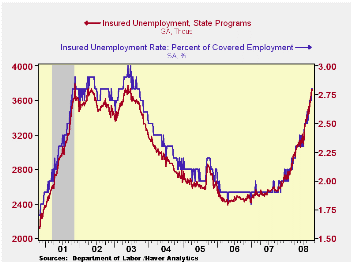
The largest increases in initial claims for the week ending Oct. 11 were in New York (+5,224), Michigan (+3,383), Florida (+3,007), California (+2,781), and South Carolina (+2,723), while the largest decreases were in Texas (-5,968), Ohio (-4,317), Alabama (-1,534), Louisiana (-828), and Delaware (-827).
Continuing claims for unemployment insurance during the week of October 11 fell 6,000 after a revised 55,000 increase during the prior week, initially reported at up 40,000. The four-week average of claims rose to this cycle's high of 3,680,000, the highest level since early 2003. Continuing claims provide some indication of workers' ability to find employment and they lag the initial claims figures by one week.
The insured rate of unemployment was stable w/w at 2.8% during the week of October 11, this cycle's high and the highest since mid-2003. The high in that recessionary period was the 3.0% reached in late June 2003.
What Exactly Is a Recession—and Are We in One? from the Federal Reserve Bank of Cleveland can be found here.
| Unemployment Insurance (000s) | 10/18/08 | 10/11/08 | 10/04/08 | Y/Y | 2007 | 2006 | 2005 |
|---|---|---|---|---|---|---|---|
| Initial Claims | 478 | 463 | 481 | 43.5% | 322 | 313 | 331 |
| Continuing Claims | -- | 3,720 | 3,726 | 46.1 | 2,552 | 2,459 | 2,662 |
by Robert Brusca European Orders Head Sharply Lower In August October 23, 2008
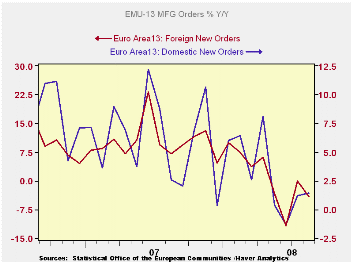
Industrial orders in the e-zone fell by a relatively sharp
1.2% in August. Still there has been enough strength recently for the
3-mo growth rate of e-Zone orders to stand at a positive 5.3%. Over six
months and 12-months orders are still declining. And in the quarter-to
date orders are falling as well at a sharp -6% pace. Order weakness
continues to be led by orders from abroad (see table). Domestic orders
are not so much stronger (see chart) as they are more volatile.
The selected country level reports in the table shows weakness
of a significant magnitude across the group albeit there are timing
differences and volatility in orders within this group. But in
Q3-to-date only Italy shows an order rise. The UK shows an annual rate
of decline at a -40% rate. Italy is posting a gain in the quarter at
nearly a 10% pace. Germany and France are showing quarter-to-date order
drops on the order of 6% to 7%.
| E-zone and UK Industrial Orders & Sales Trends | |||||||||
|---|---|---|---|---|---|---|---|---|---|
| Saar except m/m | % m/m | Aug 08 |
Aug 08 |
Aug 08 |
Aug 07 |
Aug 06 |
Qtr-2 Date |
||
| Ezone Detail | Aug 08 |
Jul 08 |
Jun 08 |
3-Mo | 6-mo | 12-mo | 12-mo | 12-mo | Saar |
| MFG Sales | 0.6% | 0.4% | 0.2% | 4.9% | 3.7% | 4.6% | 6.4% | 7.8% | 4.5% |
| Consumer | 0.4% | 0.3% | 0.1% | 3.3% | 1.9% | 1.8% | 6.4% | 7.8% | 2.9% |
| Capital | 0.3% | 0.2% | 0.1% | 2.6% | 2.2% | 3.4% | 4.4% | 4.2% | 2.3% |
| Intermediate | -0.4% | 1.8% | 1.4% | 11.8% | 0.1% | 1.5% | 8.3% | 7.1% | 5.6% |
| MFG Orders | |||||||||
| Total Orders | -1.2% | 2.0% | 0.5% | 5.3% | -5.1% | -1.5% | 5.1% | 11.6% | -1.5% |
| E-13 Domestic MFG orders | -0.4% | 1.8% | 1.4% | 11.8% | 0.1% | 1.5% | 2.6% | 7.6% | 2.5% |
| E-13 Foreign MFG orders | -2.1% | 1.9% | -0.3% | -2.4% | -11.9% | -4.0% | 7.1% | 16.4% | -5.5% |
| Countries: | Aug 08 |
Jul 08 |
Jun 08 |
3-Mo | 6-mo | 12-mo | 12-mo | 12-mo | Qtr-2 Date |
| Germany: | 3.3% | -0.7% | -2.5% | -0.3% | -6.4% | 0.1% | 5.5% | 17.0% | -6.0% |
| France: | -7.2% | 4.3% | 1.4% | -6.9% | -18.5% | -7.8% | 8.6% | -5.3% | -7.4% |
| Italy | -0.3% | 2.7% | 0.7% | 13.2% | -1.4% | 1.1% | -0.6% | 18.2% | 9.8% |
| UK(EU) | -15.2% | 2.4% | -5.0% | -53.6% | -37.2% | -16.4% | 4.2% | -3.3% | -40.7% |

Tom Moeller
AuthorMore in Author Profile »Prior to joining Haver Analytics in 2000, Mr. Moeller worked as the Economist at Chancellor Capital Management from 1985 to 1999. There, he developed comprehensive economic forecasts and interpreted economic data for equity and fixed income portfolio managers. Also at Chancellor, Mr. Moeller worked as an equity analyst and was responsible for researching and rating companies in the economically sensitive automobile and housing industries for investment in Chancellor’s equity portfolio. Prior to joining Chancellor, Mr. Moeller was an Economist at Citibank from 1979 to 1984. He also analyzed pricing behavior in the metals industry for the Council on Wage and Price Stability in Washington, D.C. In 1999, Mr. Moeller received the award for most accurate forecast from the Forecasters' Club of New York. From 1990 to 1992 he was President of the New York Association for Business Economists. Mr. Moeller earned an M.B.A. in Finance from Fordham University, where he graduated in 1987. He holds a Bachelor of Arts in Economics from George Washington University.
More Economy in Brief


