 Global| Jul 30 2009
U.S. Weekly Claims For JoblessInsurance Rise, But Falling Trend Suggests Improved Labor Market
by:Tom Moeller
|in:Economy in Brief
Summary
The rate of improvement in the job market again appears to have slowed. The latest figures from the Labor Department indicate that initial claims rose for the second consecutive week after sharp declines early in the month. The latest [...]
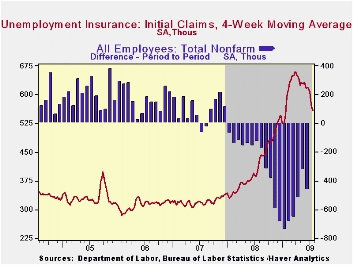
The rate of improvement in the job market again appears to have slowed. The latest figures from the Labor Department indicate that initial claims rose for the second consecutive week after sharp declines early in the month. The latest increase to 584,000 from an upwardly revised level during the prior period returned claims to near where they started July. Nevertheless, so far this month the 559,000 average level of claims is down from the 616,000 averaged during June and from the March high of 674,000. The four-week average of claims, which smoothes out some of the volatility in the weekly numbers, fell to 559,000 which was its lowest level since late-January. Claims of 580,000 had been expected during the latest week.
The Labor Department indicated that the largest increases in initial claims for the week ending July 18 were in California (+4,290, 41.1% y/y), Michigan (+3,654, 21.0% y/y), Florida (+3,291, 41.2% y/y), Connecticut (+749, 79.1% y/y), and Indiana (+526, -0.7% y/y)), while the largest decreases were in New York (-22,052, 46.2% y/y), Wisconsin (-6,791, 5.5% y/y), Missouri (-6,529, 63.1% y/y), Pennsylvania (-6,420, 60.2% y/y), and Ohio (-5,062, 28.5% y/y).
The rate of labor market improvement may have slowed, but a
trend improvement in conditions is clearly evident from the decline in
continuing claims for unemployment insurance. They fell a modest 54,000
last week after a similar decline during the prior week. However, the
average this month is down sharply from June and the weekly figure is
the lowest since mid-April. The continuing claims figures lag initial
claims by one week and provide an indication of workers' ability to
find employment. Despite the latest decline, however, the level of 6,197,000
claims still up sharply from the year ago level. The
four-week average of continuing claims fell back to 6,416,250 which was
the lowest since mid-May. The series dates back to 1966.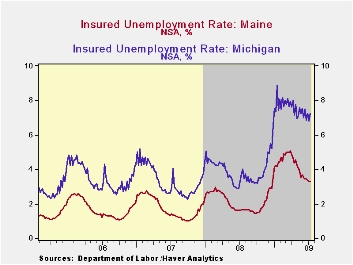
The insured rate of unemployment remained at 4.7% which was the lowest level since mid-April. During the last ten years, there has been a 93% correlation between the level of the insured unemployment rate and the overall rate of unemployment published by the Bureau of Labor Statistics.
The highest insured unemployment rates in the week ending July 11 were in Puerto Rico (7.3 percent), Michigan (7.2), Oregon (6.7), Pennsylvania (6.4), Nevada (6.2), Wisconsin (6.1), Connecticut (5.6), New Jersey (5.6), Arkansas (5.5), California (5.5), North Carolina (5.5), and South Carolina (5.5). The lowest rates were in Wyoming (3.0), Texas (3.1), Maine (3.3), Colorado (3.4), Maryland (3.6), Minnesota (3.9), Florida (4.4), Mississippi (4.4) and Georgia (4.6).
The unemployment insurance claims data is available in Haver's WEEKLY database and the state data is in the REGIONW database
The Fed's latest Beige Book covering regional economic conditions can be found here.
| Unemployment Insurance (000s) | 07/25/09 | 07/18/09 | 07/11/09 | Y/Y | 2008 | 2007 | 2006 |
|---|---|---|---|---|---|---|---|
| Initial Claims | 584 | 559 | 524 | 32.1% | 420 | 321 | 313 |
| Continuing Claims | -- | 6,197 | 6,251 | 87.3% | 3,342 | 2,552 | 2,459 |
| Insured Unemployment Rate (%) | 4.7 | 4.7 | 2.4 | 2.5 | 1.9 | 1.9 |
by Robert BruscaJuly 30, 2009
 BETTER:
The EU commission indices for EU and EMU continue to show substantial
progress. The EU index rose to 75.0 from 71.1 while the EU index rose
to 76.0 from 73.2. The better showing in the EMU rise implies a better
rise in the month by non EMU members of EU. On a mo/mo basis the UK
index did rise sharply by 7.3% compared to Spain’s 5.3%, the best among
large EMU nations.
BETTER:
The EU commission indices for EU and EMU continue to show substantial
progress. The EU index rose to 75.0 from 71.1 while the EU index rose
to 76.0 from 73.2. The better showing in the EMU rise implies a better
rise in the month by non EMU members of EU. On a mo/mo basis the UK
index did rise sharply by 7.3% compared to Spain’s 5.3%, the best among
large EMU nations.
…but still low: Overall the EU and EMU indices are standing the bottom
26% to 21% of their respective ranges. That is still a very low
reading. But the UK has bounced some 31% from its lowest level on this
overall index and Italy has risen by 25%. The least rebound by a major
EU/EMU economy is the 11.9% rises from its low reading posted by
Germany. Germany also has the lowest ranked sentiment index among large
EU/EMU economies (even though it is third highest by raw score).
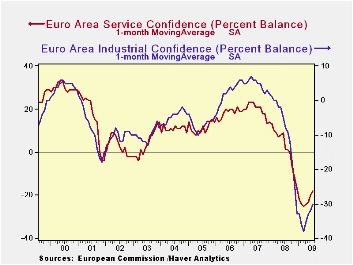
INDUSTRY: EU industry readings are only in the 19th percentile of their range like services. But unfortunately the worst reading on its components are from the selling prices expectation that is in the bottom 7% of its historic range and from orders that are in the bottom 3% of their range (both overall orders and export orders). The production trend is in the 23rd percentile of its range and production expectations are in the 35th percentile or their range - despite the weaker reading in orders. Employment is a sort of neutral 17.8 percentile reading which is the same as for EMU industry confidence overall. So we can’t say for industry that the problem is jobs, it’s just demand.
SERVICE: Services Confidence in EMU stands at it 12.1% percentile lower than for EU overall (19.0%). The weakest reading for services is from current employment which is as low a reading as it ever has seen. Current demand is the next lowest in the bottom 10 percentile of its range. The business climate in services ranks in the 12th percentile overall. Expected demand and expected employment are more upbeat but still in only the 15th percentile of their respective ranges. Despite some monthly improvement employment in this sector is weak and expectations while improving are still very weak. The weakest service sector by the relative measure of the position of the index in its range is France followed closely by Spain; the strongest is the UK.
RETAILING: Retailing ranks in the 28th percentile of its range in EMU, making it relatively less strong than in EU (35th percentile). The present situation is rated as in the 26th percentile; the expected business situation is at a higher raw reading but a lower position in its range at the 23rd range percentile. Employment expectations are a weak 8% reading. The Italy has the highest retail range reading in the 46th range percentile compared to the UK in the 42nd percentile while Spain is at a 28 percentile reading, worst reading for a large EMU country.
CONSUMER CONFIDENCE: Consumer confidence ranks about the same as the retailing reading, in the 29th percentile of its EMU range (below the 32.4 percentile for EU). Spain and Italy have the highest relative consumer rankings at or above a 50 percentile range reading; the UK reading is at the 42nd percentile. Germany stands the lowest among large EMU nations at the 16th percentile. EU consumers rate the past 12-months as in the bottom 5% of all readings historically. While the next 12-months reading posted a much, much higher 48th percentile reading.
SUMMING UP: The consumer confidence results
epitomize the EU/EMU results. Current conditions have improved from
their worst. Yet the quantitative measures that look forward are not
yet very strong. Still expectations for the future are advancing
strongly in Europe. There seems to be a much more ‘hard to pin down’
blanket optimism about the future that is in existence.
| EU Sectors and Country level Overall Sentiment | ||||||||||||
|---|---|---|---|---|---|---|---|---|---|---|---|---|
| EU | Jul-09 | Jun-09 | May-09 | Apr-09 | Percentile | Rank | Max | Min | Range | Mean | By Queue rank% | R-SQ w/Overall |
| Overall | 75 | 71.1 | 67.9 | 64 | 26.3 | 242 | 116 | 60 | 56 | 100 | 3.6% | 1.00 |
| Industrial | -30 | -33 | -34 | -36 | 19.6 | 244 | 7 | -39 | 46 | -7 | 2.8% | 0.90 |
| Consumer Confid | -21 | -23 | -26 | -28 | 32.4 | 224 | 2 | -32 | 34 | -11 | 10.8% | 0.86 |
| Retail | -14 | -17 | -17 | -21 | 35.5 | 232 | 6 | -25 | 31 | -5 | 7.6% | 0.66 |
| Construction | -37 | -37 | -39 | -38 | 10.9 | 232 | 4 | -42 | 46 | -16 | 7.6% | 0.47 |
| Services | -19 | -23 | -26 | -30 | 19.0 | 242 | 32 | -31 | 63 | 11 | 3.6% | 0.75 |
| % m/m | Jul-09 | Based on Level | Level | |||||||||
| EMU | 3.8% | 4.3% | 4.3% | 76.0 | 21.7 | 236 | 117 | 65 | 53 | 100 | 6.0% | 0.95 |
| Germany | 4.1% | 4.3% | 1.5% | 80.8 | 17.6 | 235 | 121 | 72 | 49 | 100 | 6.4% | 0.70 |
| France | 0.4% | 4.4% | 3.9% | 81.2 | 19.8 | 236 | 119 | 72 | 47 | 100 | 6.0% | 0.84 |
| Italy | 4.4% | 1.4% | 7.3% | 83.7 | 30.1 | 228 | 122 | 67 | 55 | 100 | 9.2% | 0.83 |
| Spain | 5.2% | 2.0% | 2.1% | 79.0 | 24.7 | 230 | 117 | 67 | 50 | 100 | 8.4% | 0.73 |
| Memo:UK | 7.3% | 4.1% | 7.8% | 73.8 | 24.5 | 242 | 128 | 56 | 72 | 100 | 3.6% | 0.59 |
| Since April 1988 | 251 | -Count | Services: | 251 | -Count | |||||||
| Sentiment is an index, sector readings are net balance diffusion measures | ||||||||||||

Tom Moeller
AuthorMore in Author Profile »Prior to joining Haver Analytics in 2000, Mr. Moeller worked as the Economist at Chancellor Capital Management from 1985 to 1999. There, he developed comprehensive economic forecasts and interpreted economic data for equity and fixed income portfolio managers. Also at Chancellor, Mr. Moeller worked as an equity analyst and was responsible for researching and rating companies in the economically sensitive automobile and housing industries for investment in Chancellor’s equity portfolio. Prior to joining Chancellor, Mr. Moeller was an Economist at Citibank from 1979 to 1984. He also analyzed pricing behavior in the metals industry for the Council on Wage and Price Stability in Washington, D.C. In 1999, Mr. Moeller received the award for most accurate forecast from the Forecasters' Club of New York. From 1990 to 1992 he was President of the New York Association for Business Economists. Mr. Moeller earned an M.B.A. in Finance from Fordham University, where he graduated in 1987. He holds a Bachelor of Arts in Economics from George Washington University.
More Economy in Brief


