 Global| Jan 15 2009
U.S. Weekly Claims For Jobless Insurance Back Up
by:Tom Moeller
|in:Economy in Brief
Summary
Initial claims for unemployment insurance rose last week and recovered a piece of the decline in earlier weeks. The 54,000 week-to-week increase to 524,000 followed declines of 21,000 (slightly revised) and 98,000 during the prior two [...]
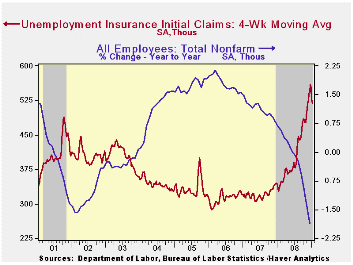
Initial claims for unemployment insurance rose last week and recovered a piece of the decline in earlier weeks. The 54,000 week-to-week increase to 524,000 followed declines of 21,000 (slightly revised) and 98,000 during the prior two weeks. These latter declines were widely attributed to aberrant seasonal factors, although a problem near this magnitude has not been observed since 2001. The latest increase exceeded Consensus expectations for a rise to 501,000.
The Labor Department indicated that the largest increases in initial claims for the week ending January 3 were in New York (+24,465), North Carolina (+19,749), Georgia (+18,308), South Carolina (+14,905), and Virginia (+7,362), while the largest decreases were in California (-14,796), Kansas (-13,313), Michigan (-11,956), Illinois (-9,727), and Ohio (-7,499).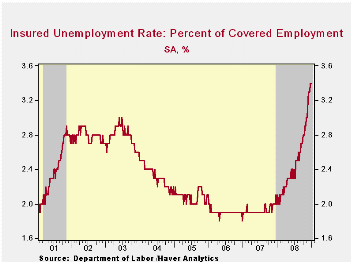
Continuing claims for unemployment insurance during the week of January 3 fell 115,000 and that reversed roughly half of the prior week's increase. The four-week average of continuing claims rose 27,500 to 4,500,000. Continuing claims provide some indication of workers' ability to find employment and they lag the initial claims figures by one week.
The insured rate of unemployment remained stable for the third week at this cycle's high of 3.4%. The highest insured unemployment rates in the week ending December 27 were in Oregon (7.4 percent), Michigan (6.6), Idaho (6.3), Wisconsin (6.0), South Carolina (5.4), Arkansas (5.3), Nevada (5.2), Pennsylvania (5.2), Indiana (5.1), and Montana (5.1).
Three Funerals and a Wedding from the Federal Reserve Bank of St. Louis is available here.
The Current Recession: How Bad Is It? also from the Federal Reserve Bank of St. Louis can be found here.
| Unemployment Insurance (000s) | 01/10/09 | 01/03/09 | 12/27/08 | Y/Y | 2008 | 2007 | 2006 |
|---|---|---|---|---|---|---|---|
| Initial Claims | 524 | 470 | 491 | 66.3% | 420 | 321 | 313 |
| Continuing Claims | -- | 4,497 | 4,612 | 64.5% | 3,342 | 2,552 | 2,459 |

Tom Moeller
AuthorMore in Author Profile »Prior to joining Haver Analytics in 2000, Mr. Moeller worked as the Economist at Chancellor Capital Management from 1985 to 1999. There, he developed comprehensive economic forecasts and interpreted economic data for equity and fixed income portfolio managers. Also at Chancellor, Mr. Moeller worked as an equity analyst and was responsible for researching and rating companies in the economically sensitive automobile and housing industries for investment in Chancellor’s equity portfolio. Prior to joining Chancellor, Mr. Moeller was an Economist at Citibank from 1979 to 1984. He also analyzed pricing behavior in the metals industry for the Council on Wage and Price Stability in Washington, D.C. In 1999, Mr. Moeller received the award for most accurate forecast from the Forecasters' Club of New York. From 1990 to 1992 he was President of the New York Association for Business Economists. Mr. Moeller earned an M.B.A. in Finance from Fordham University, where he graduated in 1987. He holds a Bachelor of Arts in Economics from George Washington University.
More Economy in Brief


