 Global| Oct 04 2005
U.S. Vehicle Sales Slide As Truck Sales Collapse
by:Tom Moeller
|in:Economy in Brief
Summary
US sales of light vehicles slid 2.6% m/m to 16.36M last month, according to the Autodata Corporation. The end of manufacturers' employee price discount programs lowered sales generally but higher gasoline prices hit light truck sales [...]
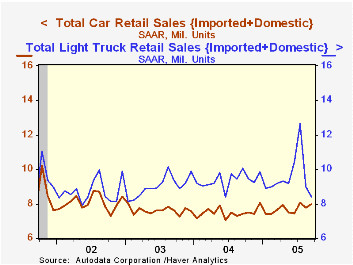
US sales of light vehicles slid 2.6% m/m to 16.36M last month, according to the Autodata Corporation. The end of manufacturers' employee price discount programs lowered sales generally but higher gasoline prices hit light truck sales especially hard.
Sales of US made cars and trucks fell 2.8% (-8.3% y/y) following the 21.8% m/m drop in August. Truck sales added a 6.2% (-16.9% y/y) decline to the 30.9% August slide. Domestic car sales benefited from consumers' switch to fuel efficiency and rose 2.1% (6.0% y/y).
Sales of imported cars & trucks slipped 1.6% m/m (+2.2% y/y). Imported car sales rose 2.6% (10.8% y/y) but truck sales fell another 9.8% (-12.7% y/y) on top of the 10.0% August decline.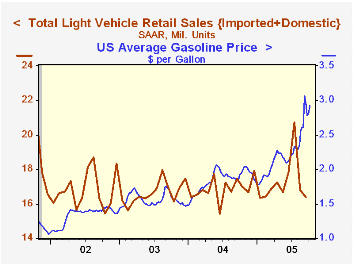
Import's share of the US light vehicle market rose slightly m/m to 20.7% versus 19.9% during all of last year.
Gasoline prices spiked 16.8% last month. In addition to the evidence from lower truck sales, consumers' response to the jump is reinforced by a 9.2% (-6.2% y/y) decline in gasoline consumption. Gas consumption typically falls sharply in September with the end of the summer driving season, but the 2005 decline was a record as was the y/y drop.
Last week US retail gasoline prices rose 12.5 cents w/w to $2.93 per gallon (+51.1% y/y) versus an average $2.90 during September.
Gasoline Prices Soar; Heating Oil Set for Winter Hike from the Federal Reserve Bank of Dallas can be found here.
Gasoline Affordability, a 2004 article from the Federal Reserve Bank of St. Louis is available here.
| Light Vehicle Sales (SAAR, Mil. Units) | Sept | Aug | Y/Y | 2004 | 2003 | 2002 |
|---|---|---|---|---|---|---|
| Total | 16.36 | 16.79 | -6.3% | 16.87 | 16.63 | 16.81 |
| Autos | 7.95 | 7.78 | 7.4% | 7.49 | 7.62 | 8.07 |
| Trucks | 8.41 | 9.01 | -16.4% | 9.37 | 9.01 | 8.74 |
by Tom Moeller October 4, 2005
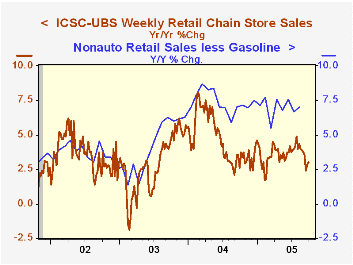
The International Council of Shopping Centers (ICSC)-UBS survey reported that chain store sales rose another 0.6% last week following a 0.1% up tick the week prior. For the full month, however, sales look to have fallen 1.7% from the August average which fell 0.1% from July.
During the last ten years there has been a 56% correlation between the y/y change in chain store sales and the change in non-auto retail sales less gasoline, as published by the US Census Department. Chain store sales correspond directly with roughly 14% of non-auto retail sales less gasoline. The leading indicator of chain store sales from ICSC jumped 1.0% higher (-1.9% y/y) following declines during four of the prior five weeks.The ICSC-UBS retail chain-store sales index is constructed using the same-store sales (stores open for one year) reported by 78 stores of seven retailers: Dayton Hudson, Federated, Kmart, May, J.C. Penney, Sears and Wal-Mart.
| ICSC-UBS (SA, 1977=100) | 09/31/05 | 09/24/05 | Y/Y | 2004 | 2003 |
|---|---|---|---|---|---|
| Total Weekly Chain Store Sales | 448.0 | 445.5 | 3.0% | 4.6% | 2.9% |
by Tom Moeller October 4, 2005
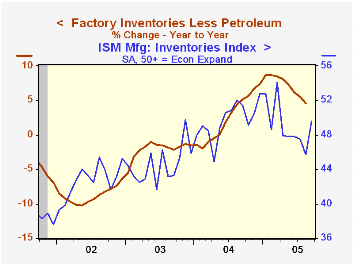
Factory inventories slipped 0.1% in August following an upwardly revised 0.6% gain in July. To emphasize a notion that the turn toward inventory restocking has not yet begun, factory inventories less petroleum gave back most of the prior month's gain, fell 0.2% and have been virtually unchanged since March.
Electrical equipment inventories fell 0.1% (+2.5% y/y) for the fourth straight monthly decline. Computer inventories also slipped 0.2% (-0.5% y/y), primary metal inventories fell 0.5% (+17.6% y/y) for the third consecutive monthly drop and fabricated metals fell for the fourth consecutive month, off 0.4% (+7.1% y/y). Machinery inventories rose 0.4% (9.7% y/y) led by turbines and construction machinery.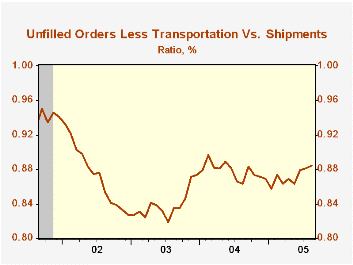
Factory shipments surged 1.7% following a downwardly revised July gain. Less a 4.7% jump in shipments from petroleum refineries, factory shipments surged 1.4% (3.6% y/y). Electrical equipment shipments jumped 2.1% (6.0% y/y) and machinery rose 1.4% (8.4% y/y).
Factory sector orders reversed all of a a deepened 2.5% decline in July. The advance report of a surge in durables orders was little revised and they rose 3.3%.
Unfilled orders added 1.6% to the 1.0% jump in July. Nondefense aircraft & parts (32.5% y/y) again led the strength with a 3.9% surge. Less the transportation sector altogether, backlogs rose 1.8% (9.0% y/y) and the ratio of unfilled orders to shipments continued a moderate climb.
| Factory Survey (NAICS) | Aug | July | Y/Y | 2004 | 2003 | 2002 |
|---|---|---|---|---|---|---|
| Inventories | -0.1% | 0.6% | 5.3% | 7.7% | -1.1% | -5.4% |
| New Orders | 2.5% | -2.5% | 7.5% | 9.3% | 3.5% | -2.5% |
| Shipments | 1.7% | 0.1% | 5.8% | 9.5% | 1.5% | -2.5% |
| Unfilled Orders | 1.6% | 1.0% | 10.1% | 8.4% | 8.0% | -8.5% |
by Louise Curley October 4, 2005
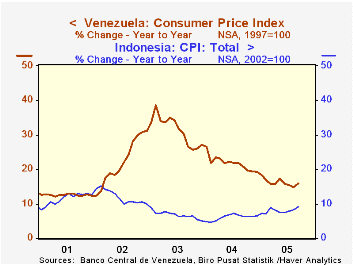
Diverse inflation rates, defined as the year-over-year percentage increases in the consumer price indexes, were reported for six countries--Indonesia, Korea, Peru, Switzerland, Turkey and Venezuela--yesterday and today.
The two oil producing countries, Indonesia and Venezuela, reported inflation rates of 16.0% and 9.1%, respectively. The trends in their inflation rates are shown in the first chart. From a peak of near 40% in mid 2002, inflation in Venezuela appears to have stabilized at about 15%. Indonesia, which is the only member of the Organization of Petroleum Exporting Countries (OPEC) that is a net oil importer, has held inflation in check, until recently, by subsidizing domestic fuel costs. On October 1, however, the government reduced, dramatically, these subsidies by almost tripling the price of kerosene and more than doubling the price of diesel. The central bank has just raised its benchmark interest rate a full point to 11%, the highest rate in more than two years to contain the expected rise in inflation.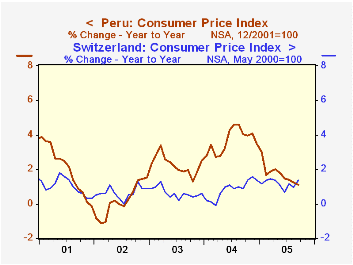
Peru which suffered bouts of hyper inflation prior to the early nineties experienced a marked decline in its inflation through early 2002, when it subsequently began to rise moderately. From a peak of 4.75% in July, 2004, it has since declined to 1.11% in September. As one of the currently low inflation countries its inflation rate is shown with that of Switzerland, another low inflation country, albeit of longer standing. In September Peru's inflation rate at 1.11% was actually below that of Switzerland's 1.36%.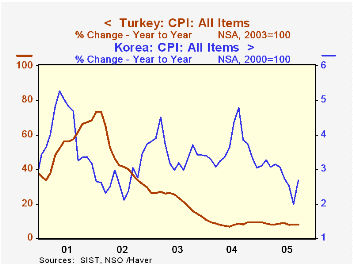
Turkey is another country that has experienced bouts of hyper inflation in the past and has since taken measures that have brought about a reduction in the rate of inflation from 73% in January, 2002 to 8% in September. In the third chart inflation in Turkey is shown with that of Korea. Different scales have been used in this chart as inflation in Korea has ranged only between roughly 2% and 5.2% while that of Turkey has ranged from 7% to 73%.
| Consumer Price Indexes | Sep 05 | Aug 05 | Sep 04 | M/M % | Y/Y % | 2004 % | 2003 % | 2002 % |
|---|---|---|---|---|---|---|---|---|
| Indonesia (2002=1000 | 124.33 | 123.48 | 114.00 | 0.89 | 9.06 | 6.06 | 6.77 | 11.91 |
| Korea (2000=100) | 119.0 | 118.2 | 115.9 | 0.68 | 2.67 | 3.59 | 3.51 | 2.76 |
| Peru (12/2001=100) | 108.58 | 108.68 | 107.39 | -0.09 | 1.11 | 3.06 | 2.26 | 0.19 |
| Switzerland (5/2000=100) | 104.7 | 104.3 | 103.3 | 0.38 | 1.36 | 0.82 | 0.63 | 0.64 |
| Turkey (2003=100) | 118.33 | 117.13 | 109.57 | 1.02 | 7.99 | 8.60 | 21.60 | 44.96 |
| Venezuela (1997=100) | 513.85 | 505.35 | 442.26 | 1.48 | 15.96 | 21.75 | 31.04 | 22.43 |

Tom Moeller
AuthorMore in Author Profile »Prior to joining Haver Analytics in 2000, Mr. Moeller worked as the Economist at Chancellor Capital Management from 1985 to 1999. There, he developed comprehensive economic forecasts and interpreted economic data for equity and fixed income portfolio managers. Also at Chancellor, Mr. Moeller worked as an equity analyst and was responsible for researching and rating companies in the economically sensitive automobile and housing industries for investment in Chancellor’s equity portfolio. Prior to joining Chancellor, Mr. Moeller was an Economist at Citibank from 1979 to 1984. He also analyzed pricing behavior in the metals industry for the Council on Wage and Price Stability in Washington, D.C. In 1999, Mr. Moeller received the award for most accurate forecast from the Forecasters' Club of New York. From 1990 to 1992 he was President of the New York Association for Business Economists. Mr. Moeller earned an M.B.A. in Finance from Fordham University, where he graduated in 1987. He holds a Bachelor of Arts in Economics from George Washington University.
More Economy in Brief


