 Global| Nov 04 2009
U.S. Vehicle Sales Recover DuringOctober
by:Tom Moeller
|in:Economy in Brief
Summary
U.S. unit sales of light vehicles during October recovered from the "payback" month of September following the summer's "cash-for-clunkers" sales program. Sales rose 13.5% m/m to 10.46M units according to the Autodata Corporation. [...]
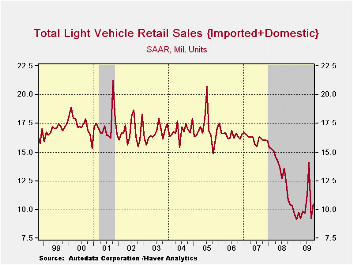
U.S. unit sales of light vehicles during October recovered from the "payback" month of September following the summer's "cash-for-clunkers" sales program. Sales rose 13.5% m/m to 10.46M units according to the Autodata Corporation. (Seasonal adjustment of the figures is provided by the U.S. Bureau of Economic Analysis). October sales were stronger than the expected 9.8M sales rate.
Sales of domestically made vehicles rose 17.2% to 7.75M units after their one-third m/m September drop. Despite the gain, sales remained 0.7% lower than October 2007. Sales of fuel efficient cars rose 11.9% following their more than one-third September decline. Light truck sales reversed most of the September drop and rose 22.2% m/m. Total sales of domestic vehicles during this year's first 10 months were down 27.5% from last year's first ten months.
Imported light vehicles rebounded after the
end of the sales program, but the increase was less than for domestic
makes. Overall sales rose just 4.1% to 2.71M after September's 36.5%
m/m drop. Sales of imported autos rose 5.2% after the one-third
September drop while the gain in imported light truck sales amounted to
just 1.6% after the more than one-third September drop. Year-to-date,
sales of imported vehicles remained 20.0% below last year's first ten
month's average.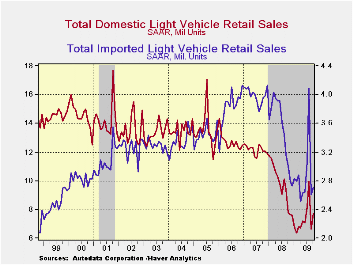
Overall, import's share of the U.S. light vehicle market fell to 25.9% last month from 28.2% in September. It reached 26.5% during all of last year. (Imported vehicles are those produced outside the United States.) Imports' share of the U.S. car market totaled 33.9%, versus 34.3% last year while the share of the light truck market was 16.9%, down from 18.3% last year.
The U.S. vehicle sales figures can be found in Haver's USECON database.
| Light Vehicle Sales (SAAR, Mil. Units) | October | September | August | Oct. Y/Y | 2008 | 2007 | 2006 |
|---|---|---|---|---|---|---|---|
| Total | 10.46 | 9.22 | 14.09 | -3.4% | 13.17 | 16.16 | 16.54 |
| Autos | 5.50 | 5.02 | 8.05 | -3.7 | 6.71 | 7.58 | 7.77 |
| Domestic | 3.64 | 3.25 | 5.26 | -1.1 | 4.42 | 5.07 | 5.31 |
| Imported | 1.87 | 1.77 | 2.78 | -8.4 | 2.29 | 2.52 | 2.45 |
| Light Trucks | 4.96 | 4.20 | 6.05 | -3.0 | 6.47 | 8.60 | 8.78 |
| Domestic | 4.12 | 3.37 | 4.75 | -0.4 | 5.29 | 7.10 | 7.42 |
| Imported | 0.84 | 0.83 | 1.31 | -13.9 | 1.18 | 1.47 | 1.37 |
ADP Report: Payroll Employment Decline Continues But The Pace Moderates
by Tom Moeller November 4, 2009
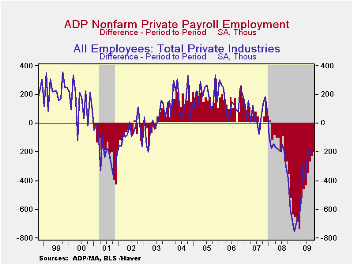 Payroll
employment fell again last month, but the rate of decline recently has
eased. The latest report from the payroll processor ADP, in their
National Employment Report, indicated that private nonfarm payrolls
fell 203,000 during October after a revised 227,000 September decline
which was shallower than reported initially. The latest reading was the
twenty-first consecutive monthly decline. The monthly change, however,
was the smallest since July of last year and two-thirds the size of the
worst reading last March. The three-month annualized rate of decline in
payrolls also eased to 2.5% from its March record of 7.1%.
Payroll
employment fell again last month, but the rate of decline recently has
eased. The latest report from the payroll processor ADP, in their
National Employment Report, indicated that private nonfarm payrolls
fell 203,000 during October after a revised 227,000 September decline
which was shallower than reported initially. The latest reading was the
twenty-first consecutive monthly decline. The monthly change, however,
was the smallest since July of last year and two-thirds the size of the
worst reading last March. The three-month annualized rate of decline in
payrolls also eased to 2.5% from its March record of 7.1%.
 ADP
compiled the estimate from its
database of individual companies' payroll information. Macroeconomic
Advisers, LLC, the St. Louis economic consulting firm, developed the
methodology for transforming the raw data into an economic
indicator.
ADP
compiled the estimate from its
database of individual companies' payroll information. Macroeconomic
Advisers, LLC, the St. Louis economic consulting firm, developed the
methodology for transforming the raw data into an economic
indicator.
The U.S. Bureau of Labor Statistics will report October payroll employment this Friday. For comparison, the September decline of 227,000 in ADP's measure of private nonfarm payrolls was accompanied by a loss of 210,000 jobs in the BLS measure of private sector payrolls. According to ADP and Macro-Advisers, the correlation between the monthly percentage change in the ADP estimate and that in the BLS data is 0.90.
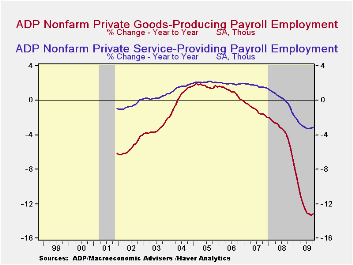
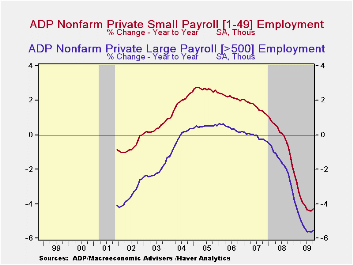
ADP reported that the decline in small-sized payrolls moderated to 75,000 (-4.3%). That matched the 75,000 (-5.5% y/y) decline in medium-sized payrolls. Large payrolls fell by 53,000 (-5.6% y/y). The steady decline in service-producing industry employment continued. The October drop of 86,000 (-3.1% y/y), was the twentieth consecutive monthly decline but in percentage terms the three-month rate of change moderated to -1.3%, less than two-thirds the worst from December through March. The decline in medium-sized service payrolls moderated to 30,000 (-3.4% y/y) and small-sized payrolls declined 34,000 (-2.8% y/y). Large service producing payrolls dropped by 22,000 and the y/y decline held steady at 3.4%.
In the goods producing sector employment fell 117,000 in October (-13.2% y/y). Here, the three-month rate of decline eased again but only to -8.4% versus -17.3% at its worst. Small-sized payrolls fell 41,000 (-12.9% y/y) followed by a 45,000 (-13.3% y/y) drop in medium-sized payrolls. Large payrolls fell 31,000 (-13.4% y/y). In the manufacturing sector alone, payrolls fell 65,000 (-12.5% y/y).
The
ADP National Employment Report data is maintained in Haver's USECON
database; historical figures date back to December 2000. The figures in
this report cover only private sector jobs and exclude employment in
the public sector, which rose an average 11,083 during the last twelve
months.
The full ADP National Employment Report can be found herep pand the ADP methodology is explained here.
| LAXEPA@USECON | October | September | Y/Y | 2008 | 2007 | 2006 |
|---|---|---|---|---|---|---|
| Total Nonfarm Private Payroll Employment (m/m Chg., 000s) | -203 | -227 | -5.0% | -0.5% | 1.2% | 2.0% |
| Small Payroll (1-49) | -75 | -90 | -4.3 | -0.0 | 1.6 | 2.2 |
| Medium Payroll (50-499) | -75 | -81 | -5.5 | -0.5 | 1.2 | 1.9 |
| Large Payroll (>500) | -53 | -56 | -5.6 | -1.6 | -0.1 | 0.4 |
Service Sector In Europe Continues To Dig Out
by Robert Brusca November 4, 2009
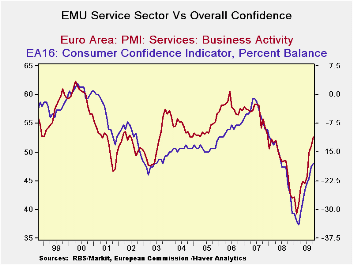
The EMU services PMI rose for the fourth month in a row. The services index is above the 50 mark for the second month running. The services PMI is on a tear as it is surging up at least as fast as it had dropped in the recession. So far so good. Still it has not restored the pre-recession level of the services index. It remains pure speculation as to how fast or soon it will recoup its pre-recession level.
The Markit PMI readings are higher and stronger in their ranges than are their counterpart indices from the European Commission. The EMU index from Markit for the service sector is in the 59th percentile of its range since May of 2000. Over the same period the EU Commission services index is in its 31st percentile about half as strong in relative terms.
The same sort of shortfalls exist across countries
In the Markit framework all the largest countries’ services sectors score above the 50 (neutral) mark except Spain whose index still lags at 47.7. But in percentile of range terms it is Germany that is lagging and stands below the mid-point mark. Germany is doing well in absolute terms but it is not doing well relative to its past performance.
On balance the rise in the services sector is sharp and still
seems to carry good upward momentum. This month among the larger
countries only Germany backtracked. In the EU the UK’s reading is up to
56.9 and stands in the 82nd percentile (top 18%) of its range. The
recovery across Europe is taking hold in the key services sector where
most of the jobs are. It’s good news.
| Markit Services Indices for EU/EMU | |||||||
|---|---|---|---|---|---|---|---|
| Oct-09 | Sep-09 | Aug-09 | 3Mo | 6Mo | 12Mo | Percentile | |
| Euro-Area | 52.58 | 50.86 | 49.92 | 51.12 | 48.09 | 44.93 | 59.8% |
| Germany | 50.73 | 52.06 | 53.82 | 52.20 | 49.18 | 46.61 | 47.9% |
| France | 57.71 | 53.16 | 49.30 | 53.39 | 50.20 | 46.74 | 69.1% |
| Italy | 52.20 | 48.53 | 46.42 | 49.05 | 46.18 | 43.08 | 57.4% |
| Spain | 47.74 | 46.39 | 45.34 | 46.49 | 43.44 | 38.41 | 59.8% |
| Ireland | 47.37 | 45.46 | 46.71 | 46.51 | 43.95 | 38.67 | 42.4% |
| EU only | |||||||
| UK (CIPs) | 56.90 | 55.30 | 54.07 | 55.42 | 53.81 | 48.58 | 82.1% |
| EU Commission Indices for EU and EMU | |||||||
| EU Index | Oct-09 | Sep-09 | Aug-09 | 3Mo | 6Mo | 12Mo | Percentile |
| EU Services | -11 | -11 | -11 | -19.67 | -22.50 | -26.75 | 43.2% |
| EMU | Oct-09 | Sep-09 | Aug-09 | 3Mo | 6Mo | 12Mo | Percentile |
| Services | -7 | -9 | -11 | -9.00 | -14.67 | -19.67 | 31.0% |
| Cons Confidence | -18 | -19 | -22 | -19.67 | -22.50 | -22.03 | 43.2% |
| Consumer confidence by country | |||||||
| Germany-Ccon | -16 | -19 | -23 | -19.33 | -24.17 | -25.67 | 39.5% |
| France-Ccon | -21 | -24 | -32 | -25.67 | -27.50 | -31.00 | 40.0% |
| Ital-Ccon | -18 | -16 | -15 | -16.33 | -18.33 | -23.17 | 40.0% |
| UK-Ccon | -8 | -10 | -16 | -11.33 | -14.83 | -21.67 | 71.1% |
| percentile is over range since May 2000 | |||||||
U.S. ISM Nonmanufacturing Index Ticks Lower But Stays Near May '08 High
by Tom Moeller November 4, 2009
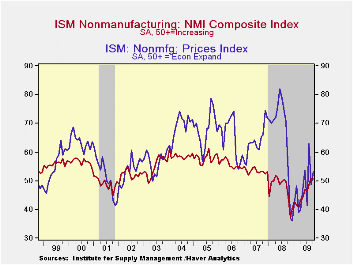
Improvement in service sector activity continued to be evident
in the latest purchasing report. Though the October Composite Index for
the nonmanufacturing sector from the Institute for Supply Management
(ISM) ticked slightly lower to 50.6, it still was nearly its highest
level since May of last year. The latest figure roughly equaled
Consensus expectations. A level of the ISM index above 50 indicates
rising overall service sector activity. Since the series' inception in
1997 there has been a 64% correlation between the level of the
composite index in the nonmanufacturing sector and the Q/Q change in
real GDP for the services and the construction sectors.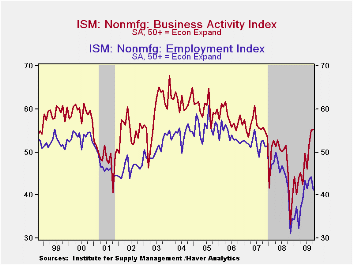
ISM surveys more than 370 purchasing managers in more than 62 industries including law firms, hospitals, government and retailers. The nonmanufacturing survey dates back to July 1997. The figures are available in Haver's USECON database.
Amongst the components, there was broad-based improvement
tempered by a lower employment reading. The business activity index for
the service sector remained above the break-even level of 50 for the
third month. The new orders series also remained at its highest in two
years, up from November's low of 35.6. The speed of vendor deliveries
fell further (higher index level) to its slowest since January. Only
the employment index deteriorated, falling to its lowest level since
May. Since the series' inception in 1997 there has been an 80%
correlation between the level of the ISM nonmanufacturing employment
index and the m/m change in payroll employment in the service-producing
plus the construction industries.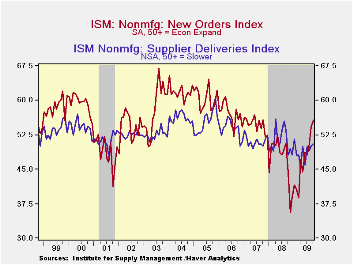
Pricing power improved as the overall index moved back above 50. The pricing index ticked just slightly higher m/m to 53.0 but was up sharply from the December low of 36.1. Since its inception ten years ago, there has been a 73% correlation between the price index and the q/q change in the GDP services chain price index.
Beginning with the January 2008 Nonmanufacturing Report On Business®, the composite index is calculated as an indicator of the overall economic condition for the non-manufacturing sector. It is a composite index based on the diffusion indices of four of the indicators (business activity, new orders, employment and supplier deliveries) with equal weights. The latest report from the ISM can be found here.
| ISM Nonmanufacturing Survey | October | September | August | Oct. '08 | 2008 | 2007 | 2006 |
|---|---|---|---|---|---|---|---|
| Composite Index | 50.6 | 50.9 | 48.4 | 44.6 | 47.4 | 53.5 | 55.7 |
| Business Activity | 55.2 | 55.1 | 51.3 | 44.5 | 47.4 | 56.0 | 58.0 |
| New Orders | 55.6 | 54.2 | 49.9 | 44.3 | 47.0 | 54.8 | 57.1 |
| Employment | 41.1 | 44.3 | 43.5 | 41.7 | 43.8 | 52.0 | 53.8 |
| Supplier Deliveries | 50.5 | 50.0 | 49.0 | 48.0 | 51.1 | 51.1 | 53.8 |
| Prices Index | 53.0 | 48.8 | 63.1 | 53.3 | 66.0 | 63.8 | 65.3 |
Challenger Layoffs Moderate Further
by Tom Moeller November 4, 2009
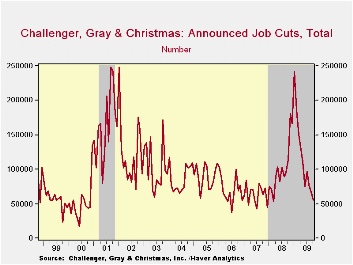
The outplacement firm of Challenger, Grey & Christmas indicated that job cut announcements fell further last month to a new current cycle low. Layoffs dropped to 55,679, compared to a high of 241,748 cuts in January of this year.
During the last ten years there has been a 67% (inverse) correlation between the three month moving average of announced job cuts and the three month change payroll employment. Job cut announcements differ from layoffs. Many are achieved through attrition, early retirement or just never occur.
Layoffs have moderated sharply in the chemical, consumer goods, financial, health care, media and telecommunication industries. They picked up modestly in the computer and entertainment/leisure industries.
The Challenger figures are available in Haver's SURVEYS database.
| Challenger, Gray & Christmas | October | September | Y/Y | 2008 | 2007 | 2006 |
|---|---|---|---|---|---|---|
| Announced Job Cuts | 55,679 | 66,404 | -50.7% | 1,223,993 | 768,264 | 839,822 |
FOMC Cites Economic Improvement But Leaves Rates Unchanged
by Tom Moeller November 4, 2009
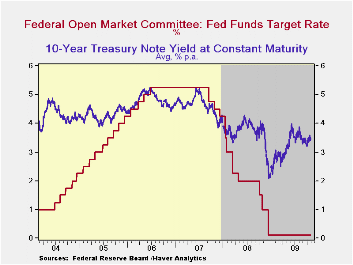
In an anticipated and unanimous vote, the Federal Open Market Committee today left the Federal funds rate in a "range from 0 to 1/4 percent." The discount rate also was left unchanged at 0.5%. The action was as expected and left the Fed funds rate at its lowest level ever.
Citing economic improvement, the Fed stated that "Activity in
the housing sector has increased over recent
months. Household spending appears to be expanding
but remains constrained by ongoing job losses, sluggish income growth,
lower housing wealth, and tight credit. Businesses are still cutting
back on fixed investment and staffing, though at a
slower pace; they continue to make progress in bringing inventory
stocks into better alignment with sales."
Continued strengthening of economic activity in a "context of price stability" was anticipated.
Regarding inflation the FOMC statement again indicated that
"With substantial resource slack likely to continue to dampen cost
pressures and with longer-term inflation expectations stable, the
Committee expects that inflation will remain subdued for some time."
In its effort to promote economic liquidity, the Fed used similar language as during the last meeting. "... the Federal Reserve will continue to employ a wide range of tools to promote economic recovery and to preserve price stability. The Committee will maintain the target range for the federal funds rate at 0 to 1/4 percent and continues to anticipate that economic conditions, including low rates of resource utilization, subdued inflation trends, and stable inflation expectations, are likely to warrant exceptionally low levels of the federal funds rate for an extended period. To provide support to mortgage lending and housing markets and to improve overall conditions in private credit markets, the Federal Reserve will purchase a total of $1.25 trillion of agency mortgage-backed securities and about $175 billion of agency debt. The amount of agency debt purchases, while somewhat less than the previously announced maximum of $200 billion, is consistent with the recent path of purchases and reflects the limited availability of agency debt. In order to promote a smooth transition in markets, the Committee will gradually slow the pace of its purchases of both agency debt and agency mortgage-backed securities and anticipates that these transactions will be executed by the end of the first quarter of 2010. The Committee will continue to evaluate the timing and overall amounts of its purchases of securities in light of the evolving economic outlook and conditions in financial markets. The Federal Reserve is monitoring the size and composition of its balance sheet and will make adjustments to its credit and liquidity programs as warranted.
A complete text of the Fed's latest press release can be found here.
The Haver databases USECON, WEEKLY and DAILY contain the figures from the Federal Reserve Board.
The Determinants of International Flows of U.S. Currency from the Federal Reserve Bank of New York can be found here.
| Current | Last | December | 2008 | 2007 | 2006 | |
|---|---|---|---|---|---|---|
| Federal Funds Rate, % (Target) | 0.00 - 0.25 | 0.00 - 0.25 | 0.16 | 1.93 | 5.02 | 4.96 |
| Discount Rate, % | 0.50 | 0.50 | 0.50 | 2.39 | 5.86 | 5.96 |

Tom Moeller
AuthorMore in Author Profile »Prior to joining Haver Analytics in 2000, Mr. Moeller worked as the Economist at Chancellor Capital Management from 1985 to 1999. There, he developed comprehensive economic forecasts and interpreted economic data for equity and fixed income portfolio managers. Also at Chancellor, Mr. Moeller worked as an equity analyst and was responsible for researching and rating companies in the economically sensitive automobile and housing industries for investment in Chancellor’s equity portfolio. Prior to joining Chancellor, Mr. Moeller was an Economist at Citibank from 1979 to 1984. He also analyzed pricing behavior in the metals industry for the Council on Wage and Price Stability in Washington, D.C. In 1999, Mr. Moeller received the award for most accurate forecast from the Forecasters' Club of New York. From 1990 to 1992 he was President of the New York Association for Business Economists. Mr. Moeller earned an M.B.A. in Finance from Fordham University, where he graduated in 1987. He holds a Bachelor of Arts in Economics from George Washington University.
More Economy in Brief


