 Global| Apr 02 2010
U.S. Vehicle Sales Recover
by:Tom Moeller
|in:Economy in Brief
Summary
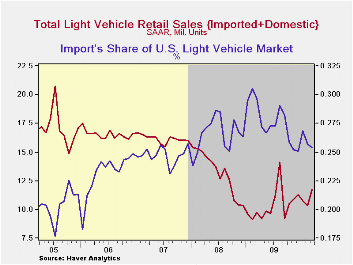
Making up sales which earlier had suffered from "special" factors, U.S. unit sales of light vehicles during March jumped to 11.78M units (SAAR) from 10.38M in February. The latest was the highest level since last August when [...]
 Making up
sales which earlier had suffered from "special" factors, U.S.
unit sales of light vehicles during March jumped to
11.78M units (SAAR) from 10.38M in February. The latest was the highest
level since last August when aggressive sales promotions lifted sales.
March sales fell slightly short of Consensus expectations for 12.0M.
(Seasonal adjustment of these figures is provided by the U.S. Bureau of
Economic Analysis).
Making up
sales which earlier had suffered from "special" factors, U.S.
unit sales of light vehicles during March jumped to
11.78M units (SAAR) from 10.38M in February. The latest was the highest
level since last August when aggressive sales promotions lifted sales.
March sales fell slightly short of Consensus expectations for 12.0M.
(Seasonal adjustment of these figures is provided by the U.S. Bureau of
Economic Analysis).
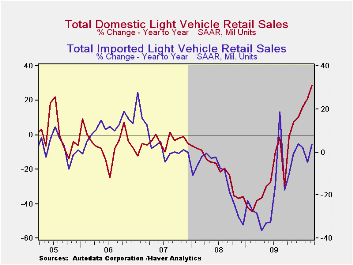
Sales of domestically produced
 vehicles jumped 14.0% last month to 8.79M units (28.5% y/y)
from 7.71M in February. Sales of fuel efficient cars rose 11.8% for the
month (28.8% y/y) while light truck sales also posted a solid 16.0% m/m
gain (28.3% y/y). Imported light vehicle sales
recovered 12.0% (3.7% y/y) after a sharp February decline, due in part
to the recall of some Toyota models. With a 5.9% gain, sales of
imported autos recovered all of the February loss while light truck
sales were stronger with a m/m gain of 24.9%, though just 1.7% y/y.
vehicles jumped 14.0% last month to 8.79M units (28.5% y/y)
from 7.71M in February. Sales of fuel efficient cars rose 11.8% for the
month (28.8% y/y) while light truck sales also posted a solid 16.0% m/m
gain (28.3% y/y). Imported light vehicle sales
recovered 12.0% (3.7% y/y) after a sharp February decline, due in part
to the recall of some Toyota models. With a 5.9% gain, sales of
imported autos recovered all of the February loss while light truck
sales were stronger with a m/m gain of 24.9%, though just 1.7% y/y.
Overall, import's share of the U.S. light vehicle market during February fell to 25.4%. The share has been declining erratically from its high of 30.5% in February '09 and from 27.6% during all of last year. (Imported vehicles are those produced outside the United States.) Imports' share of the U.S. car market fell m/m to 31.8% and that was below 34.8% during 2009. Imports' share of the light truck market improved to 18.7% but remained below the 19.6% last year.
The U.S. vehicle sales figures can be found in Haver's USECON database.
| Light Vehicle Sales (SAAR, Mil. Units) | March | February | January | March Y/Y | 2009 | 2008 | 2007 |
|---|---|---|---|---|---|---|---|
| Total | 11.78 | 10.38 | 10.78 | 21.2% | 10.37 | 13.22 | 16.16 |
| Autos | 6.04 | 5.49 | 5.70 | 20.1 | 5.46 | 6.76 | 7.58 |
| Domestic | 4.12 | 3.68 | 3.78 | 28.8 | 3.56 | 4.44 | 5.06 |
| Imported | 1.92 | 1.81 | 1.92 | 4.8 | 1.90 | 2.32 | 2.52 |
| Light Trucks | 5.74 | 4.88 | 5.08 | 22.4 | 4.91 | 6.46 | 8.60 |
| Domestic | 4.67 | 4.03 | 4.11 | 28.3 | 3.95 | 5.28 | 7.10 |
| Imported | 1.07 | 0.86 | 0.97 | 1.7 | 0.96 | 1.18 | 1.47 |

Tom Moeller
AuthorMore in Author Profile »Prior to joining Haver Analytics in 2000, Mr. Moeller worked as the Economist at Chancellor Capital Management from 1985 to 1999. There, he developed comprehensive economic forecasts and interpreted economic data for equity and fixed income portfolio managers. Also at Chancellor, Mr. Moeller worked as an equity analyst and was responsible for researching and rating companies in the economically sensitive automobile and housing industries for investment in Chancellor’s equity portfolio. Prior to joining Chancellor, Mr. Moeller was an Economist at Citibank from 1979 to 1984. He also analyzed pricing behavior in the metals industry for the Council on Wage and Price Stability in Washington, D.C. In 1999, Mr. Moeller received the award for most accurate forecast from the Forecasters' Club of New York. From 1990 to 1992 he was President of the New York Association for Business Economists. Mr. Moeller earned an M.B.A. in Finance from Fordham University, where he graduated in 1987. He holds a Bachelor of Arts in Economics from George Washington University.
More Economy in Brief


