 Global| May 10 2007
U.S. Trade Gap Widens on Oil and Without Oil
Summary
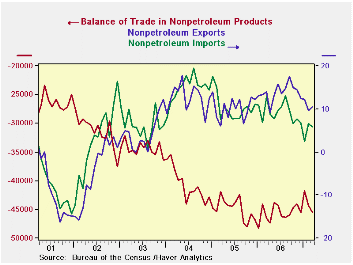
Exports outpace imports in nominal terms and shrink the non-oil trade balance. But BOTH export and import growth rates are moderating. The non-oil export and import flows take the distorting effect of oil out of the equation. These [...]
Exports outpace imports in nominal terms and shrink the non-oil trade balance. But BOTH export and import growth rates are moderating.
The non-oil export and import flows take the distorting effect of oil out of the equation. These nominal flows show that the value of export growth is still outstripping the value of US import growth. But were we to compare the real (inflation adjusted flows) we would find that real export and import growth rates have in fact converged. This tells us that one of the contributions of the weaker dollar has been to strengthen US export prices. As the dollar falls, US export prices automatically get cheaper in foreign currency terms, improving the competitive position of US exporters. But as this happens exporters often take the opportunity to hike dollar prices and augment profit margins. As long as dollar export prices rise by less than the fall in the dollar, US firms are in the enviable position of getting higher dollar prices while charging lower foreign currency prices at the same time. Still export growth is slowing in both real and nominal terms. And import growth is slowing as well.
The table below shows flows based on inflation adjusted data. Overall export growth is - and has been - losing speed despite talk of better growth abroad. Indeed a number of countries’ foreign trade statistics issued recently show some similar themes. Germany and France display a certain weakness in consumer goods weakness in the exportation – and importation - of consumer goods. In Europe we also find that consumer spending remains stunted within the various domestic economies. This is something to worry about.
US exports show a drop in the growth rate for capital goods autos & parts and consumer goods. The catch-all ‘other category’ is also slowing. While foods, feeds and beverage flows are not slowing, they are slow. Contrarily, while consumer goods exports are slowing they are NOT slow.
AS for imports, real imports have been consistent and slow; and they are also marginally decelerating. But foods, feeds and beverage inflows are accelerating as are industrial supplies and materials (the category that contains oil). More optimistically, capital goods imports have accelerated. But for autos and parts, consumer goods and the miscellaneous category of ‘other’ imports are decelerating.
The SURGE in the March trade deficit (-$63.9 from -$57.9) will chip a bit more off of already weak GDP growth – but not as much as some may think…
That monthly result is a nominal -$72bil worsening in the month at an annual rate… that, in turn, is one third of the quarter so that result worsens the quarter by $24bil more at an annual rate in nominal terms. It could shave another 0.2% to 0.3% off GDP’s already weak growth rate. The subtraction from GDP might have been worse except that much of the import surge is in oil and it is due to PRICE; that blunts the impact of the trade widening on REAL GDP. Both exports and imports show strong growth in the month and that is a PRO-GROWTH sign for the economy. Much of the surge in the trade gap this month is in petroleum and products where imports rose by 17% (m/m) in March. The Non-Oil deficit worsened by only $1.2bil in the month or $0.4bil for the quarter that is less than $5bil annualized, in nominal terms… And that is why the likely subtraction from GDP due to trade does not worsen by much more than a few decimal points.
| Category | Current | Previous | $SA % SAAR | MEMO: | ||
| % M/M: Current & Previous | Previous | |||||
| Mar 2007 | M:% | M:% | 3-MO | 6-MO | Yr/Yr | Yr/Yr |
| Real Exports | 2.2% | -3.8% | -1.4% | 0.8% | 5.2% | 11.9% |
| Foods, Feeds & Beverages | -6.5% | -3.2% | -18.5% | -19.5% | -5.5% | 7.0% |
| Industrial Materials | 3.8% | -4.1% | 3.8% | -6.5% | 1.1% | 9.2% |
| Capital Goods | 1.2% | -5.9% | -8.8% | -1.6% | 4.3% | 15.5% |
| Autos & Parts | 6.8% | 3.1% | 11.0% | 24.4% | 13.5% | 9.4% |
| Consumer Goods | 2.4% | -2.8% | 13.5% | 20.5% | 10.7% | 10.6% |
| Other | 4.7% | -1.6% | -3.0% | -0.5% | 22.5% | 12.6% |
| Real Imports | 3.5% | -2.2% | 4.3% | 5.4% | 4.9% | 9.2% |
| Foods, Feeds & Beverages | 5.1% | 0.2% | 27.4% | 13.3% | 2.7% | 14.6% |
| Industrial Materials | 7.7% | -7.7% | 11.7% | 2.9% | 3.9% | 0.3% |
| Capital Goods | -0.1% | -1.2% | 8.9% | 2.2% | 4.6% | 16.8% |
| Autos & Parts | 4.3% | -1.1% | -16.1% | 6.5% | 3.0% | 10.9% |
| Consumer Goods | 1.7% | 2.3% | 2.2% | 9.7% | 8.1% | 12.6% |
| Other | -0.3% | 0.3% | -10.2% | 3.8% | 2.6% | 5.9% |

Robert Brusca
AuthorMore in Author Profile »Robert A. Brusca is Chief Economist of Fact and Opinion Economics, a consulting firm he founded in Manhattan. He has been an economist on Wall Street for over 25 years. He has visited central banking and large institutional clients in over 30 countries in his career as an economist. Mr. Brusca was a Divisional Research Chief at the Federal Reserve Bank of NY (Chief of the International Financial markets Division), a Fed Watcher at Irving Trust and Chief Economist at Nikko Securities International. He is widely quoted and appears in various media. Mr. Brusca holds an MA and Ph.D. in economics from Michigan State University and a BA in Economics from the University of Michigan. His research pursues his strong interests in non aligned policy economics as well as international economics. FAO Economics’ research targets investors to assist them in making better investment decisions in stocks, bonds and in a variety of international assets. The company does not manage money and has no conflicts in giving economic advice.
More Economy in Brief


