 Global| May 10 2007
U.S. Trade Gap Widens on Oil and Without Oil
Summary
Exports outpace imports in nominal terms and shrink the non-oil trade balance. But BOTH export and import growth rates are moderating. The non-oil export and import flows take the distorting effect of oil out of the equation. These [...]
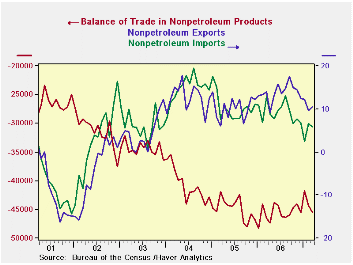
Exports outpace imports in nominal terms and shrink the non-oil trade balance. But BOTH export and import growth rates are moderating.
The non-oil export and import flows take the distorting effect of oil out of the equation. These nominal flows show that the value of export growth is still outstripping the value of US import growth. But were we to compare the real (inflation adjusted flows) we would find that real export and import growth rates have in fact converged. This tells us that one of the contributions of the weaker dollar has been to strengthen US export prices. As the dollar falls, US export prices automatically get cheaper in foreign currency terms, improving the competitive position of US exporters. But as this happens exporters often take the opportunity to hike dollar prices and augment profit margins. As long as dollar export prices rise by less than the fall in the dollar, US firms are in the enviable position of getting higher dollar prices while charging lower foreign currency prices at the same time. Still export growth is slowing in both real and nominal terms. And import growth is slowing as well.
The table below shows flows based on inflation adjusted data. Overall export growth is - and has been - losing speed despite talk of better growth abroad. Indeed a number of countries’ foreign trade statistics issued recently show some similar themes. Germany and France display a certain weakness in consumer goods weakness in the exportation – and importation - of consumer goods. In Europe we also find that consumer spending remains stunted within the various domestic economies. This is something to worry about.
US exports show a drop in the growth rate for capital goods autos & parts and consumer goods. The catch-all ‘other category’ is also slowing. While foods, feeds and beverage flows are not slowing, they are slow. Contrarily, while consumer goods exports are slowing they are NOT slow.
AS for imports, real imports have been consistent and slow; and they are also marginally decelerating. But foods, feeds and beverage inflows are accelerating as are industrial supplies and materials (the category that contains oil). More optimistically, capital goods imports have accelerated. But for autos and parts, consumer goods and the miscellaneous category of ‘other’ imports are decelerating.
The SURGE in the March trade deficit (-$63.9 from -$57.9) will chip a bit more off of already weak GDP growth – but not as much as some may think…
That monthly result is a nominal -$72bil worsening in the month at an annual rate… that, in turn, is one third of the quarter so that result worsens the quarter by $24bil more at an annual rate in nominal terms. It could shave another 0.2% to 0.3% off GDP’s already weak growth rate. The subtraction from GDP might have been worse except that much of the import surge is in oil and it is due to PRICE; that blunts the impact of the trade widening on REAL GDP. Both exports and imports show strong growth in the month and that is a PRO-GROWTH sign for the economy. Much of the surge in the trade gap this month is in petroleum and products where imports rose by 17% (m/m) in March. The Non-Oil deficit worsened by only $1.2bil in the month or $0.4bil for the quarter that is less than $5bil annualized, in nominal terms… And that is why the likely subtraction from GDP due to trade does not worsen by much more than a few decimal points.
| Category | Current | Previous | $SA % SAAR | MEMO: | ||
| % M/M: Current & Previous | Previous | |||||
| Mar 2007 | M:% | M:% | 3-MO | 6-MO | Yr/Yr | Yr/Yr |
| Real Exports | 2.2% | -3.8% | -1.4% | 0.8% | 5.2% | 11.9% |
| Foods, Feeds & Beverages | -6.5% | -3.2% | -18.5% | -19.5% | -5.5% | 7.0% |
| Industrial Materials | 3.8% | -4.1% | 3.8% | -6.5% | 1.1% | 9.2% |
| Capital Goods | 1.2% | -5.9% | -8.8% | -1.6% | 4.3% | 15.5% |
| Autos & Parts | 6.8% | 3.1% | 11.0% | 24.4% | 13.5% | 9.4% |
| Consumer Goods | 2.4% | -2.8% | 13.5% | 20.5% | 10.7% | 10.6% |
| Other | 4.7% | -1.6% | -3.0% | -0.5% | 22.5% | 12.6% |
| Real Imports | 3.5% | -2.2% | 4.3% | 5.4% | 4.9% | 9.2% |
| Foods, Feeds & Beverages | 5.1% | 0.2% | 27.4% | 13.3% | 2.7% | 14.6% |
| Industrial Materials | 7.7% | -7.7% | 11.7% | 2.9% | 3.9% | 0.3% |
| Capital Goods | -0.1% | -1.2% | 8.9% | 2.2% | 4.6% | 16.8% |
| Autos & Parts | 4.3% | -1.1% | -16.1% | 6.5% | 3.0% | 10.9% |
| Consumer Goods | 1.7% | 2.3% | 2.2% | 9.7% | 8.1% | 12.6% |
| Other | -0.3% | 0.3% | -10.2% | 3.8% | 2.6% | 5.9% |
by Robert Brusca May 10, 2007
Import prices jump by 1.3% as petroleum prices head higher by 6.5% in the month. Ex-petroleum import price rise by a cool 0.2%.
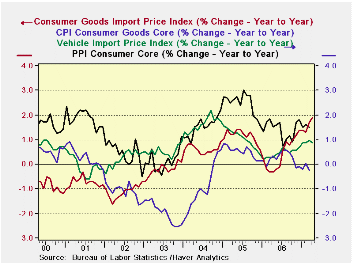
Import prices are rising much more rapidly since March of 2006. Consumer goods import prices are up by 1.8% Yr/Yr compared falling year over year one year ago- that’s an acceleration of 2 percentage points and that could become worrisome. The chart shows that the impact on consumer goods import prices is still on its upward trend. While that is a considerable net change for import price inflation, it is still a moderate rate of inflation overall for import prices, 1.8%. Still that pace has not ‘infected’ core consumer goods prices whose rate of change continues to plod along in a downtrend with Yr/yr gains near ZERO in March. Vehicle import prices also have picked up since March of last year as well; but they are only rising at 1% Yr/Yr with less than a 1% acceleration Yr/Yr. Domestic prices for consumer goods from the PPI report show that core prices are up by 1.6% Yr/Yr more than consumer prices but a step or two behind import prices. While the weaker dollar may be transmitting some clear inflation impulses, they are at the same time very mild and finding some resistance in getting into final consumer prices at all. On balance this is still good inflation news since the dollar has been week and the economy has fought–off the inflation transmission which itself has been only mildly present in import prices. 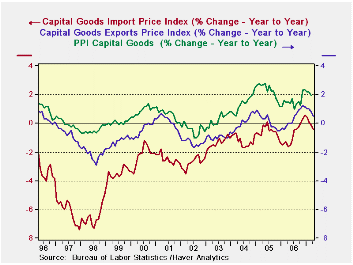
For capital goods prices the trends are curiously different. Inflation is being LED by domestic capital goods prices. While the pattern for export prices mimics that for US inflation in capital goods, export price inflation is below that for to domestically produced capital goods. Capital goods import prices are lower still but have begun to track more closely the US domestic and export measures. Capital goods inflation is generally trending although it is just above 2% domestically and half that for exports and near zero for imported capital goods. There is a hint of inflation abating for capital goods but the tailing trend is still quite recent.
The table of export and import prices trends lies below. It show that ex-petroleum price trends are not gathering momentum in general with the 3-mo inflation rate for them at 1.1% compared to 2.3% for six months and 2.9% for 12-Months. The trend for non-petroleum import prices is actually waning as petroleum import prices accelerate. Conversely non-agricultural export prices are clearly accelerating, but most of this reflects the inclusion of petroleum in industrial and supplies prices. That category is the only strongly accelerating one for non-Ag export prices.
On balance while there is some evidence of pressure on import prices, that pressure is muted and consumer goods are showing NO tendency to embrace any of the inflation from faster-rising import prices for consumer goods. Indeed, apart from oil, import prices that have accelerated over 12 months now are showing signs of deceleration.
| M/MO | SAAR | |||||
| IMPORTS | Apr-07 | Mar-07 | Feb-07 | 3-MO | 6-MO | 12-MO |
| ALL Imports | 1.3% | 1.5% | 0.4% | 13.3% | 7.2% | 1.9% |
| Excl Petrol | 0.2% | 0.3% | 0.0% | 1.9% | 3.7% | 2.9% |
| Petrol | 6.5% | 8.1% | 1.7% | 87.7% | 25.1% | -1.8% |
| Foods Feeds and Beverages | 1.4% | -0.2% | 0.2% | 6.2% | 8.9% | 8.8% |
| Industrial Supplies | 3.7% | 4.5% | 1.0% | 43.6% | 19.9% | 3.2% |
| Capital Goods | -0.4% | -0.2% | -0.3% | -3.9% | -1.5% | -0.4% |
| Motor Vehicles & Parts | 0.0% | 0.1% | 0.1% | 0.8% | 0.4% | 0.9% |
| Consumer goods excl autos | 0.1% | 0.1% | 0.0% | 0.8% | 1.6% | 1.9% |
| M/MO | SAAR | |||||
| EXPORTS | Apr-07 | Mar-07 | Feb-07 | 3-MO | 6-MO | 12-MO |
| ALL Exports | 0.3% | 0.6% | 0.8% | 7.3% | 6.6% | 4.9% |
| Agricultural | -1.3% | 2.0% | 2.8% | 15.0% | 24.0% | 19.0% |
| Non Agricultural | 0.4% | 0.5% | 0.6% | 6.6% | 5.3% | 3.9% |
| Foods Feeds and Beverages | -0.8% | 2.3% | 3.2% | 20.1% | 24.9% | 20.2% |
| Industrial Supplies | 1.3% | 1.7% | 2.0% | 22.2% | 15.4% | 10.2% |
| Capital Goods | -0.1% | -0.1% | 0.0% | -0.8% | 0.4% | 0.5% |
| Motor Vehicles & Parts | 0.1% | 0.1% | 0.1% | 1.1% | 1.3% | 1.3% |
| Consumer goods excl autos | 0.5% | 0.0% | 0.0% | 1.9% | 2.7% | 2.6% |
by Carol Stone May 10, 2007
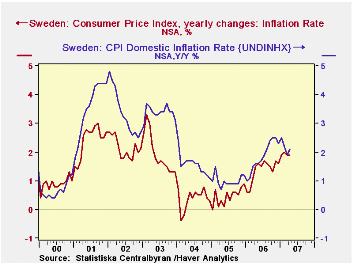
CPI data reported today by the three Scandinavian countries illustrate well the reasons for monitoring both total inflation measures and "core" measures to determine the underlying trends. Moreover, the "core" measure applicable to an individual country may vary from those used elsewhere, depending on the structure of each economy.
So in Sweden, we see the total CPI inflation rate at 1.9% over the 12 months through April, extending a generally increasing trend that began in early 2005. But apparently, the Swedes concentrate on another gauge, "UNDINHX", the so-called "domestic inflation rate". This index was 2.1% in April, but that's slower than it has been for the last six months. The grouping excludes home mortgage interest, some indirect taxes and goods that are mainly imported; this last would have the effect of omitting most fuel. Since last fall, interest rates have risen noticeably in Sweden while energy costs have slowed. Clothing prices have slowed and "other" prices have also eased. The rise in interest rates pushed up the total inflation rate, but the weaker inflation in other areas lowered the "domestic inflation rate".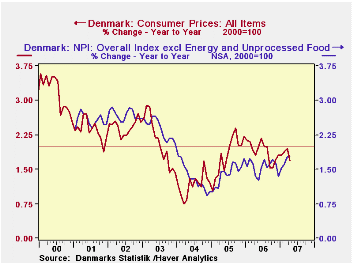
In Denmark, recent price movements have been fairly muted, and in general inflation is running pretty consistently at 1.7%-1.8%. The overall CPI was up 1.69% in April from April 2006. The favored version of the CPI in that country seems to be the NPI, "net price index", which nets out the impact of indirect taxes. In Haver's data offerings in the NORDIC database, values are given only for summary CPI categories, but net price indexes are available for numerous lower level line items. The total net price index was up 1.76% in April, year on year. Several "special groupings" are available; one seen in our chart alongside excludes energy and unprocessed food, a familiar concept of a "core" rate. This index was up 1.77% in April and has had a tendency toward firming. Home maintenance expenses, home furnishings and communications costs have been rising, in particular. Energy, as elsewhere, has been easing recently.
Norway reports very low inflation. Its overall CPI is up a mere 0.3% in the 12 months through April. And a rundown of the broad categories suggest a pretty mixed bag. Clothing prices, for example, are weak, while furniture and hotels and restaurants are up. If we exclude taxes, inflation is 0.9%, showing that reduced tax impact took 0.6% off April's inflation rate. Energy prices have been mixed, but have also pulled down on the inflation rate. Household heating and electricity have fallen, while auto-related expenses have increased. Overall, energy took 1.2 percentage points of the CPI. When the tax and energy effects both are netted out, the CPI was up 1.4% in April, still a low rate by world standards.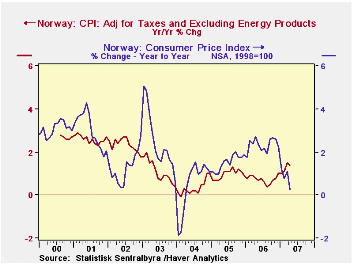
We see here that indirect taxes are important in these countries and that efforts to assess genuine "price" inflation, that is, what we would refer to as the "core" rate, require adjustment to remove the taxes. In the US, by contrast, a national VAT or GST is not in use and excise taxes play only a modest role. The main concern in this country is over volatile items where supply factors have a heavy weight, that is, food and energy. The countries discussed here net out mortgage interest costs. The UK also does this. The US eliminated those from the CPI nearly 25 years ago, substituting a "rental equivalence" measure for the direct input of interest charges. Japan, in another example of a varying definition of "core", now calculates two "core" rates, the original that excludes only fresh foods and a "Western" style that also excludes energy costs. The former remains the more popular. Thus, while it is convenient in some senses to have the European practice of "harmonized" inflation measures, it also continues to make just as much sense for each country to retain its own price index structure that fits the character of its own national economy.
| Apr 2007 | Mar 2007 | Feb 2007 | December/December||||
|---|---|---|---|---|---|---|
| 2006 | 2005 | 2004 | ||||
| Sweden: Inflation Rate | 1.9 | 1.9 | 2.0 | 1.6 | 0.9 | 0.3 |
| Domestic Inflation Rate (UNDINHX*) | 2.1 | 1.9 | 2.2 | 2.3 | 1.2 | 1.1 |
| Denmark: All Items | 1.7 | 2.0 | 1.9 | 1.8 | 2.2 | 1.2 |
| Net Prices ex Energy & Unprocessed Food | 1.8 | 1.8 | 1.6 | 1.3 | 1.7 | 1.0 |
| Norway: CPI | 0.3 | 1.1 | 0.8 | 2.2 | 1.8 | 1.0 |
| Adjusted for Tax / Excl Energy | 1.4 | 1.5 | 1.1 | 1.0 | 0.9 | 1.0 |
by Robert Brusca May 10, 2007
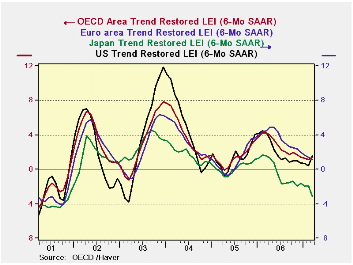
While there has been a lot talk above a de-linking of Europe from the US, a rather careful look at the LEIs plotted on the left shows that at least in terms of these signals the US usually calls the tune and the rest of the OECD marches behind. There is NO EVIDENCE of the rest of the world pulling the US up. Instead, it is the US pulling itself up by its own bootstraps while the rest of the world is still under downward pressure in the lexicon of the OECD indicators. The Euro area is slowing. Japan remains quite weak. Meanwhile, the US is showing new life in the OECD framework.
This chart is DEBUNKING the idea of DE-LINKING.
The table below shows that OECD trends point to continuing weakness for Europe and Japan as well as for the whole of the Euro area. Meanwhile the US is signaling rebound and that has helped the OECD area to show some technical improvement.
The top portion of the table labeled ‘progressive growth rates’ shows slightly more weakness that the bottom that looks at spaced 6-month trends. This discrepancy tells us that the weakness is still more new than it is entrenched. And fortunately the US is pulling out ahead of the pack.
I am much more comfortable with the notion that the US is recovering and that will carry Europe than with the notion that Europe will grow and support the US. I don’t believe in the tooth fairy or in de-linking.
| Growth Progression-SAAR | ||||
| 3Mos | 6Mos | 12mos | Yr-Ago | |
| OECD | 1.7% | 1.8% | 1.2% | 3.5% |
| OECD Big 7 | 0.3% | 0.8% | 0.3% | 2.8% |
| OECD.Europe | 0.6% | 1.2% | 1.7% | 3.6% |
| OECD.Japan | -5.0% | -3.0% | -2.9% | 1.4% |
| OECD US | 2.2% | 2.1% | 0.7% | 3.4% |
| Six-Month Readings at 6-Month Intervals: | ||||
| Recent six | 6Mo Ago | 12Mo Ago | 18MO Ago | |
| OECD | 1.8% | 0.7% | 4.9% | 2.1% |
| OECD Big 7 | 0.8% | -0.2% | 4.2% | 1.4% |
| OECD.Europe | 1.2% | 2.2% | 4.9% | 2.4% |
| OECD.Japan | -3.0% | -2.7% | 1.4% | 1.4% |
| OECD US | 2.1% | -0.7% | 5.6% | 1.1% |
| Slowdowns indicated by bold red | ||||

Robert Brusca
AuthorMore in Author Profile »Robert A. Brusca is Chief Economist of Fact and Opinion Economics, a consulting firm he founded in Manhattan. He has been an economist on Wall Street for over 25 years. He has visited central banking and large institutional clients in over 30 countries in his career as an economist. Mr. Brusca was a Divisional Research Chief at the Federal Reserve Bank of NY (Chief of the International Financial markets Division), a Fed Watcher at Irving Trust and Chief Economist at Nikko Securities International. He is widely quoted and appears in various media. Mr. Brusca holds an MA and Ph.D. in economics from Michigan State University and a BA in Economics from the University of Michigan. His research pursues his strong interests in non aligned policy economics as well as international economics. FAO Economics’ research targets investors to assist them in making better investment decisions in stocks, bonds and in a variety of international assets. The company does not manage money and has no conflicts in giving economic advice.
More Economy in Brief


