 Global| Jul 02 2021
U.S. Trade Deficit Widens in May with Increases in Both Exports and Imports
Summary
• Trade deficit second largest in 29-year history of series. • Services led by gains in travel, both exports and imports. • Imports of goods from China fall 11.3%. The U.S. trade deficit in goods and services widened moderately to [...]
• Trade deficit second largest in 29-year history of series.
• Services led by gains in travel, both exports and imports.
• Imports of goods from China fall 11.3%.
The U.S. trade deficit in goods and services widened moderately to $71.24 billion in May from $69.07 billion in April; the earlier month was revised slightly from $68.90 billion. The May deficit was the second largest in the history of this series, which goes back to January 1992; the largest was just in March, $75.02 billion. The Action Economics Forecast Survey expected a $71.4 billion deficit.
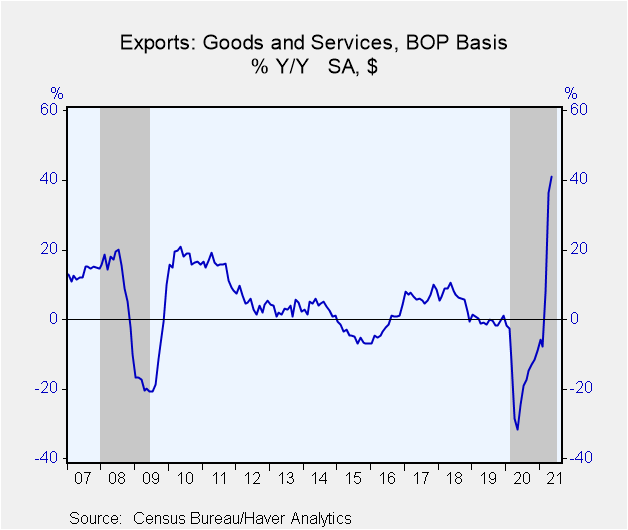
Both exports and imports increased in May. Exports rose 0.6% m/m (41.0% y/y) following April's 1.0% advance, while imports were up 1.3% m/m (+37.9% y/y), basically reversing their April 1.4% decrease. Both petroleum and nonpetroleum imports increased in May.
The trade deficit in goods widened to $89.2 billion in May from $86.9 billion in April. This May figure was slightly larger than the $88.1 billion deficit in the advance report released on June 24. Exports of goods increased 0.3% (+59.8% y/y) in May, led by a 5.8% monthly gain in consumer goods ex autos. Food exports grew 2.1% and industrial supplies and materials increased 0.3%. The previous two sizable monthly advances in capital goods were somewhat reversed in May as those exports decreased 1.0%. Auto exports fell 4.6% and "other" edged down 0.4% in May.
Petroleum imports rose 10.5% in May (+181.6% y/y). Nonpetroleum imports rose 0.5% m/m in May and rose 34.4% y/y. This y/y comparison is based in the very bottom of the pandemic-ridden period in the spring of 2020, with a huge y/y increase therefore hardly surprising.
The real (adjusted for price changes) trade deficit widened moderately to $101.8 billion (chained 2012 dollars) in May from $98.8 billion in April. Net exports in the national accounts subtracted 1.5%-points from overall real GDP growth in Q1. The average of the real deficit in April and May is still less than in Q1, but the positive contribution to growth is reduced from just the April reading alone. But the May widening in trade would still leave in place the first positive contribution to growth since the deep plunge in the economy in Q2 2020.
The surplus of trade in services widened slightly in May to $17.9 billion following two months at $17.8 billion. The three months March, April and May, are the narrowest such surpluses since the spring and summer of 2012. In May, the value of services exports rose 1.5% (+9.9% y/y), led by a 10.6% monthly increase in travel. Service imports rose 1.8% m/m (+27.7% y/y) in May; gains were again widespread and again led by travel, which surged 17.5% m/m and 382.7% y/y.
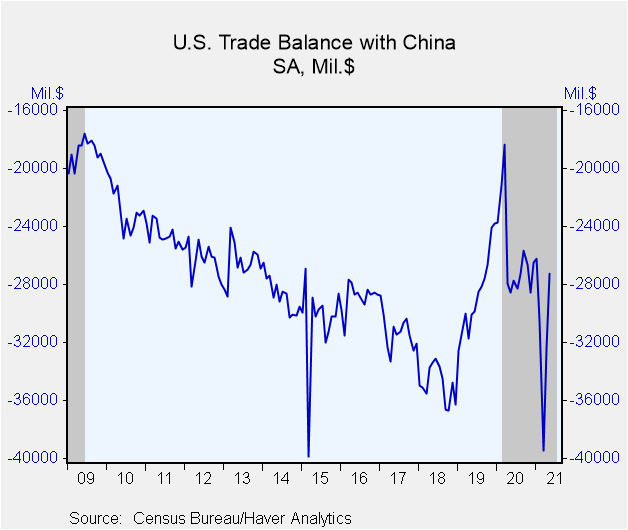
The goods trade deficit with China narrowed to a seasonally adjusted $27.2 billion from 32.3 billion in April. Exports edged down 0.2% while imports slumped 11.3% m/m. The trade deficit with Japan widened modestly in May to $5.8 billion from $5.4 billion in April, while the deficit with the European Union widened to $18.5 billion from $16.1 billion.
The international trade data, including relevant data on oil prices, can be found in Haver's USECON database. Detailed figures on international trade are available in the USINT database. The expectations figures are from the Action Economics Forecast Survey in AS1REPNA.
| Foreign Trade in Goods & Services (Current $) | May | Apr | Mar | May '20 | 2020 | 2019 | 2018 |
|---|---|---|---|---|---|---|---|
| U.S. Trade Deficit ($ bil.) | 71.24 | 69.07 | 75.03 | 54.92 | 676.69 | 576.34 | 580.95 |
| Y/Y% | |||||||
| Exports of Goods & Services (% Chg) | 0.6 | 1.0 | 7.5 | 41.0 | -15.6 | -0.4 | 6.2 |
| Imports of Goods & Services (% Chg) | 1.3 | -1.4 | 7.1 | 37.9 | -9.5 | -0.5 | 7.4 |
| Petroleum (% Chg) | 10.5 | -1.4 | 17.4 | 181.6 | -39.7 | -14.0 | 20.8 |
| Nonpetroleum Goods (% Chg) | 0.5 | -2.0 | 7.1 | 34.4 | -3.5 | -0.5 | 7.3 |
Carol Stone, CBE
AuthorMore in Author Profile »Carol Stone, CBE came to Haver Analytics in 2003 following more than 35 years as a financial market economist at major Wall Street financial institutions, most especially Merrill Lynch and Nomura Securities. She had broad experience in analysis and forecasting of flow-of-funds accounts, the federal budget and Federal Reserve operations. At Nomura Securities, among other duties, she developed various indicator forecasting tools and edited a daily global publication produced in London and New York for readers in Tokyo. At Haver Analytics, Carol was a member of the Research Department, aiding database managers with research and documentation efforts, as well as posting commentary on select economic reports. In addition, she conducted Ways-of-the-World, a blog on economic issues for an Episcopal-Church-affiliated website, The Geranium Farm. During her career, Carol served as an officer of the Money Marketeers and the Downtown Economists Club. She had a PhD from NYU's Stern School of Business. She lived in Brooklyn, New York, and had a weekend home on Long Island.


