 Global| Apr 10 2008
U.S. Trade Deficit Surprisingly Deeper in February
by:Tom Moeller
|in:Economy in Brief
Summary
The U.S. foreign trade deficit widened surprisingly to $62.3B from 59.0B in January which was only slightly revised. Consensus expectations had been for a shallower deficit of $57.5B during February. Much of the surprise in the [...]
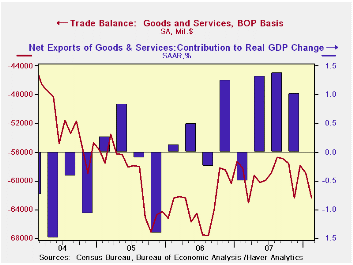
The U.S. foreign trade deficit widened surprisingly to $62.3B from 59.0B in January which was only slightly revised. Consensus expectations had been for a shallower deficit of $57.5B during February.
Much of the surprise in the February trade report was that despite the weaker U.S. economy, imports of nonpetroleum products jumped 5.4%. That rise fully reversed declines in three of the prior four months. The m/m gains in imports of capital goods (5.3% y/y), motor vehicles (7.3% y/y), and nonauto consumer goods (3.2% y/y) all were quite strong and reversed weakness posted during prior months.
Lower oil prices caused the value of energy related imports to decline by 12.5% and petroleum imports to fall by 5.1%. Crude oil prices rose just 0.8% to an average $84.76 per barrel but that was a record high. The quantity of oil imports, however, responded to the higher prices and fell 11.1% m/m (+13.3% y/y).
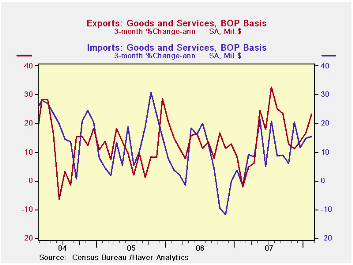
U.S. exports during February continued strong and rose 2.0% after a 1.7% rise in January. Exports of goods overall rose 2.5% (21.2% y/y) due to strong exports of foods, feeds & beverages which rose 7.8% (47.4% y/y). Exports of industrial supplies & materials also jumped by 6.3% (33.9% y/y) but exports of capital goods fell by 1.7% (+12.2% y/y) for the third decline in the last four months. Exports of civilian aircraft fell 3.0% (+25.1% y/y) after a sharp January decline. Exports of computers rose 6.1% (0.55 y/y) after a strong 5.3% gain January. Exports of nonauto consumer goods fell 1.0% (+15.3% y/y) after two months of strong gain.
The U.S. trade deficit in goods with China eased slightly m/m to $18.40B and remained well below last year's monthly record of $25.9B. The slower U.S. economy slowed growth in imports from China to 4.5% during the last twelve months after growth between 10% and 30% during the last several years. Exports to China in February grew 24.7% y/y after growth 20% and 30% during the prior for years.
| Foreign Trade | February | January | Y/Y | 2007 | 2006 | 2005 |
|---|---|---|---|---|---|---|
| U.S. Trade Deficit | $62.3B | $59.0B | $58.2B (2/07) |
$708.5 | $758.5 | $714.4B |
| Exports - Goods & Services | 2.0% | 1.7% | 20.8% | 12.6% | 12.7% | 10.9% |
| Imports - Goods & Services | 3.1% | 1.8% | 16.4% | 6.0% | 10.4% | 12.9% |
| Petroleum | -5.1% | 11.3% | 78.8% | 9.5% | 20.1% | 39.6% |
| Nonpetroleum Goods | 5.4% | -0.6% | 6.3% | 4.6% | 9.1% | 10.3% |
by Tom Moeller April 10, 2008
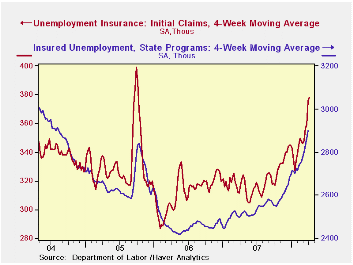
Initial unemployment insurance claims last week retraced all of the prior period's surge. The 53,000 decline to 357,000 followed a little revised 39,000 rise during the prior week and dropped claims to their lowest level since early March. The decline outpaced Consensus expectation for a lesser decline to 380,000and clearly indicated that the early Easter Holiday played a role in boosting the seasonally adjusted level of claims during the prior week.
Nevertheless, the two week average of initial claims remained elevated at 384,000, near its highest since 2005.
A claims level below 400,000 typically has been associated with growth in nonfarm payrolls. During the last ten years there has been a (negative) 76% correlation between the level of initial claims and the m/m change in nonfarm payroll employment.
The four week moving average of initial claims rose to 378,250
(19.4% y/y), also its highest level since 2005.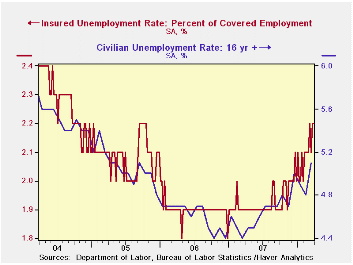
Continuing claims for unemployment insurance rose by 3,000. The increase followed an 85,000 worker surge during the prior week which was revised down just slightly. Insured unemployment was at its highest level since mid 2004. The figure provides some indication of workers' ability to find employment.
The continuing claims numbers lag the initial claims figures by one week.
The insured rate of unemployment remained elevated at 2.2%.
Yesterday's testimony by Federal Reserve Board Governor Randall S. Kroszner on the Federal Housing Administration Housing Stabilization and Homeownership Act can be found here.
| Unemployment Insurance (000s) | 04/04/08 | 03/28/08 | Y/Y | 2007 | 2006 | 2005 |
|---|---|---|---|---|---|---|
| Initial Claims | 357 | 410 | 8.8% | 322 | 313 | 331 |
| Continuing Claims | -- | 2,940 | 17.3% | 2,552 | 2,459 | 2,662 |
by Robert Brusca April 10, 2008
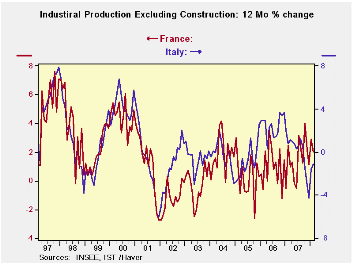
France and Italy often put their respective industrial sectors on a common trend. Although French IP has been expanding from mid 2006 to late 2007, Italy’s IP was declining and losing momentum in that period. However from late 2007 forward Italy and France appear to have industrial output on an upward path again. In the first quarter French IP is up at a 3% annual rate. In Italy the pace of expansion is a stronger 5.8%. Italian consumer goods output is stronger too at 7.4% compared to 2.2% for consumer goods in France. Both are seeing strong capital goods output again with Italy’s 18.5% leading but France’s 6.5% is still strong.
The sequential growth rates tell the story with France showing steady growth over 12 months, 6 months and 3 months. Italy, however, has been in a slump. Its 12-month and 6-month growth rates are negative with the six-month pace the weaker of the two. In the recent three months Italy has sprung back to life. Both Italy and France have posted growth in IP of about 6% over the recent three months. In this period, France’s growth is more balanced while Italy’s growth is from the capital goods sector.
With Europe undergoing various financial and exchange rate pressures it is not clear that France and Italy are really joined at the hip again as they once were. They’re in step over the past three months but beyond that growth is a question mark and so too must be the outlook for French and Italian IP. Germany’s IP echoes the strength we see in the French and Italian industrial sectors. But German orders have been flagging. Europe remains an enigma.
| French IP Excluding Construction | |||||||
|---|---|---|---|---|---|---|---|
| Saar exept m/m | Feb-08 | Jan-08 | Dec-07 | 3-mo | 6-mo | 12-mo | Qtr to-date |
| IP total | 0.3% | 0.6% | 0.7% | 6.3% | 1.1% | 2.0% | 3.0% |
| Consumer Goods | 0.2% | 1.5% | -0.7% | 4.0% | -4.7% | -1.0% | 2.2% |
| Capital Goods | 1.3% | 0.5% | 0.0% | 7.7% | 4.8% | 6.4% | 6.5% |
| Intermediate Goods | 0.2% | 1.4% | 0.1% | 7.1% | 1.4% | 1.0% | 4.8% |
| Memo | |||||||
| Auto | -1.9% | 2.1% | 3.4% | 15.3% | 3.9% | 0.3% | 8.7% |
| Italy IP Excluding Construction | |||||||
| Saar exept m/m | Feb-08 | Jan-08 | Dec-07 | 3-mo | 6-mo | 12-mo | -Qtr to-date |
| IP-MFG | -0.3% | 1.8% | 0.0% | 6.1% | -5.2% | -1.9% | 5.8% |
| Consumer Goods | -2.6% | 3.6% | -1.0% | 0.0% | -8.3% | -0.7% | 7.4% |
| Capital Goods | 0.0% | 6.3% | -2.4% | 15.6% | -0.8% | -0.7% | 18.5% |
| Intermediate Goods | -0.6% | 1.4% | 0.1% | 3.5% | -6.1% | -2.4% | 3.3% |
| Memo | |||||||
| Transportation | 1.5% | 2.9% | -3.0% | 4.9% | -5.7% | 1.2% | 0.0% |

Tom Moeller
AuthorMore in Author Profile »Prior to joining Haver Analytics in 2000, Mr. Moeller worked as the Economist at Chancellor Capital Management from 1985 to 1999. There, he developed comprehensive economic forecasts and interpreted economic data for equity and fixed income portfolio managers. Also at Chancellor, Mr. Moeller worked as an equity analyst and was responsible for researching and rating companies in the economically sensitive automobile and housing industries for investment in Chancellor’s equity portfolio. Prior to joining Chancellor, Mr. Moeller was an Economist at Citibank from 1979 to 1984. He also analyzed pricing behavior in the metals industry for the Council on Wage and Price Stability in Washington, D.C. In 1999, Mr. Moeller received the award for most accurate forecast from the Forecasters' Club of New York. From 1990 to 1992 he was President of the New York Association for Business Economists. Mr. Moeller earned an M.B.A. in Finance from Fordham University, where he graduated in 1987. He holds a Bachelor of Arts in Economics from George Washington University.
More Economy in Brief


