 Global| Mar 09 2006
U.S. Trade Deficit Surged Due to Higher Imports
by:Tom Moeller
|in:Economy in Brief
Summary
The U.S. foreign trade deficit surged during January to $68.5B, another record, and far exceeded Consensus expectations for a deficit of $66.5B. The December deficit in goods & services trade was revised slightly lower to $65.1B. [...]
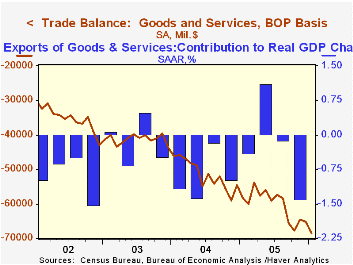
The U.S. foreign trade deficit surged during January to $68.5B, another record, and far exceeded Consensus expectations for a deficit of $66.5B. The December deficit in goods & services trade was revised slightly lower to $65.1B.
Overall imports rose 3.5% in January and the gains were quite broad, starting with a 5.6% (48.3%) spike in petroleum imports. That gain was bolstered by a 4.4% rise in crude oil prices (46.0% y/y) to an average $51.93 per bbl., the first m/m gain since September. Crude prices gave back roughly half of that increase last month and very recently fell even lower. The quantity of crude oil imports fell during January (-6.2% y/y) for the second consecutive month.
Imports of nonpetroleum products similarly were strong during January, rising 3.8% (11.2% y/y). The gain was led by a 3.8% (9.9% y/y) rise in capital goods and a 2.9% (5.6% y/y) increase in nonauto consumer goods. Imports of advanced technology products fell 8.1% (NSA, 15.2% y/y).
Total exports also were strong during January. A 2.5% increase was led by a 2.9% (16.3% y/y) gain in capital goods though exports of nonauto consumer goods fell 1.3% (+11.3% y/y). Exports of advanced technology products dropped 10.1% (NSA, +20.7% y/y) while exports of foods, feeds & beverages jumped 11.2% (15.7% y/y).
With China the US trade deficit reversed most of an improvement during December and deteriorated to $17.9B ($201.6B for 2005) but y/y exports were up by more than one third. The trade deficit with Japan improved for the third straight month to $6.5B ($82.7B in 2005) though the trade deficit with the Asian NICs nearly doubled to $2.2B ($15.9B in 2005). The deficit with the European Union improved for the third consecutive month $9.7B ($122.4B in 2005) as imports fell 6.0% (+12.7% y/y).
During 2005, the total real value of US international trade (exports plus imports) rose to 27.2% of constant dollar GDP, up from 20.3% ten years earlier and was more than double the percentage during 1985.
Current account, remarks by Alan Greenspan, are available here.
| Foreign Trade | Jan | Dec | Y/Y | 2005 | 2004 | 2003 |
|---|---|---|---|---|---|---|
| Trade Deficit | $68.5B | $65.1B | $58.3B (1/05) | $723.6B | $617.6B | $494.8B |
| Exports - Goods & Services | 2.5% | 2.2% | 12.0% | 10.5% | 12.6% | 4.6% |
| Imports - Goods & Services | 3.5% | 1.7% | 14.0% | 12.8% | 16.6% | 8.5% |

Tom Moeller
AuthorMore in Author Profile »Prior to joining Haver Analytics in 2000, Mr. Moeller worked as the Economist at Chancellor Capital Management from 1985 to 1999. There, he developed comprehensive economic forecasts and interpreted economic data for equity and fixed income portfolio managers. Also at Chancellor, Mr. Moeller worked as an equity analyst and was responsible for researching and rating companies in the economically sensitive automobile and housing industries for investment in Chancellor’s equity portfolio. Prior to joining Chancellor, Mr. Moeller was an Economist at Citibank from 1979 to 1984. He also analyzed pricing behavior in the metals industry for the Council on Wage and Price Stability in Washington, D.C. In 1999, Mr. Moeller received the award for most accurate forecast from the Forecasters' Club of New York. From 1990 to 1992 he was President of the New York Association for Business Economists. Mr. Moeller earned an M.B.A. in Finance from Fordham University, where he graduated in 1987. He holds a Bachelor of Arts in Economics from George Washington University.
More Economy in Brief


