 Global| Nov 13 2008
U.S. Trade Deficit Shrank With Lower Oil Prices & Recession
by:Tom Moeller
|in:Economy in Brief
Summary
The U.S. foreign trade deficit narrowed in September somewhat more than expected. At $56.5B versus an unrevised $59.1B during August, the deficit was its smallest since last October. So far this year the monthly trade deficit has [...]
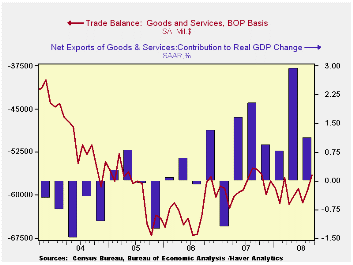
The U.S. foreign trade deficit narrowed in September somewhat more than expected. At $56.5B versus an unrevised $59.1B during August, the deficit was its smallest since last October. So far this year the monthly trade deficit has averaged $59.4B, still deeper than the $58.5B averaged during the first nine months of 2007.
Adjusted for price inflation the August trade deficit in goods improved to $39.0B from $40.9B in July. Year-to-date the real deficit has narrowed by $10.0B versus 2007 to an average $46.1B as real exports surged 10.3% and real imports fell 1.2%. A narrower trade deficit was estimated to have added 1.1 percentage points to real GDP growth last quarter following a 2.9 point addition during 2Q.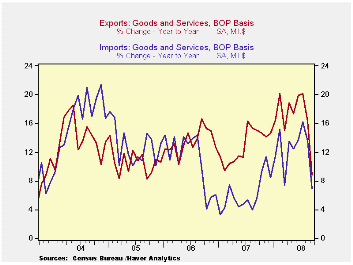
Lower oil prices helped imports shrink 5.6% after a 2.2% decline during August. Imports of all energy-related products fell 21.4% (+31.9% y/y) as the value of crude petroleum imports fell by more than one quarter. That drop owed to a decline in the average price per barrel of crude oil to $107.58 (+57.2% y/y) from a high of $124.7 in July. The developing U.S. recession prompted a 15.1% decline (-16.2% y/y) in the daily quantity of crude petroleum imports.
Recessionary forces were additionally evident in the 3.6% decline in the value of nonpetroleum imports. Measured in chained 2000 dollars nonoil imports fell 2.7% (-3.7% y/y), pulled lower by a 7.8% decline (-0.9% y/y) in real imports of nonauto consumer goods. The chained dollar value of imports of automotive vehicles & parts also fell by another 3.7% (-17.9% y/y). Real imports of nonauto capital goods reversed their August decline and rose 1.5% (0.9% y/y).
Services imports reversed past strength and fell 3.4% (+6.7% y/y). Travel imports fell by 2.7% with the developing economic weakness (+4.0% y/y) while passenger fares fell 3.9% (+5.8% y/y). Both of these y/y increases are down sharply, from 12% for travel and from 20% for passenger fares, as of early this year.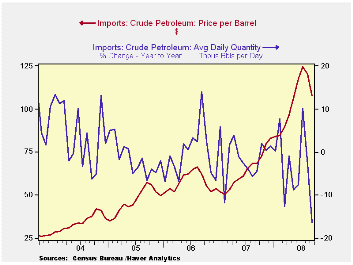
As economies abroad weakened exports fell by 6.0% (+8.8% y/y) during September. The decline reflected an 8.3% drop in goods exports. Adjusted for prices, chained dollar goods exports fell 7.8% (+2.3% y/y) led lower by a 9.6% (-0.8% y/y) drop in capital goods. Exports of autos & parts fell 1.4% (-2.0% y/y) after their 13.9% August plunge while real exports of nonauto consumer goods fell 3.3% (+4.7% y/y) on the heels of their 5.9% August drop. Adding to this weakness was a 10.8% (-5.4% y/y) drop in real exports of foods, feeds & beverages.
Nominal exports of services ticked 0.1% lower (+9.3% y/y) as travel exports fell 2.3% (+16.7% y/y). Passenger fares slipped 0.6% (+31.0% y/y). Exports of "other" private services have deteriorated markedly but ticked up 1.6% during September. Year-to-year growth fell to 4.7% after an 18.2% gain during all of last year.
The U.S. trade deficit in goods with China deepened to a record $27.8B and during the first nine months of this year averaged $21.7B versus $20.8B during the first nine months of 2007. Exports to China fell 18.2% last month (-5.1% y/y) after 18.2% growth during all of last year and imports rose 3.9% (12.5% y/y). The trade deficit with Japan deepened to $5.6B but during the first nine months of this year it is down to average of $6.3B from an average $6.8B during the first nine months of last year.
| Foreign Trade | September | August | Y/Y | 2007 | 2006 | 2005 |
|---|---|---|---|---|---|---|
| U.S. Trade Deficit | $56.5B | $59.1B | $55.5B (9/07) | $700.3 | $753.3 | $711.6B |
| Exports - Goods & Services | -6.0% | -1.7% | 8.8% | 13.0% | 13.5% | 10.6% |
| Imports - Goods & Services | -5.6% | -2.2% | 6.9% | 6.1% | 10.8% | 12.8% |
| Petroleum | -15.7% | -13.9% | 31.5% | 9.4% | 20.1% | 39.6% |
| Nonpetroleum Goods | -3.6% | 1.0% | 1.6% | 4.8% | 9.1% | 10.3% |

Tom Moeller
AuthorMore in Author Profile »Prior to joining Haver Analytics in 2000, Mr. Moeller worked as the Economist at Chancellor Capital Management from 1985 to 1999. There, he developed comprehensive economic forecasts and interpreted economic data for equity and fixed income portfolio managers. Also at Chancellor, Mr. Moeller worked as an equity analyst and was responsible for researching and rating companies in the economically sensitive automobile and housing industries for investment in Chancellor’s equity portfolio. Prior to joining Chancellor, Mr. Moeller was an Economist at Citibank from 1979 to 1984. He also analyzed pricing behavior in the metals industry for the Council on Wage and Price Stability in Washington, D.C. In 1999, Mr. Moeller received the award for most accurate forecast from the Forecasters' Club of New York. From 1990 to 1992 he was President of the New York Association for Business Economists. Mr. Moeller earned an M.B.A. in Finance from Fordham University, where he graduated in 1987. He holds a Bachelor of Arts in Economics from George Washington University.
More Economy in Brief


