 Global| Nov 13 2008
U.S. Trade Deficit Shrank With Lower Oil Prices & Recession
by:Tom Moeller
|in:Economy in Brief
Summary
The U.S. foreign trade deficit narrowed in September somewhat more than expected. At $56.5B versus an unrevised $59.1B during August, the deficit was its smallest since last October. So far this year the monthly trade deficit has [...]
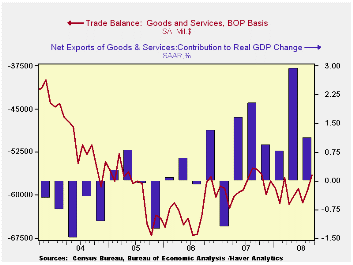
The U.S. foreign trade deficit narrowed in September somewhat more than expected. At $56.5B versus an unrevised $59.1B during August, the deficit was its smallest since last October. So far this year the monthly trade deficit has averaged $59.4B, still deeper than the $58.5B averaged during the first nine months of 2007.
Adjusted for price inflation the August trade deficit in goods
improved to $39.0B from $40.9B in July. Year-to-date the real deficit
has narrowed by $10.0B versus 2007 to an average $46.1B as real exports
surged 10.3% and real imports fell 1.2%. A narrower trade deficit was
estimated to have added 1.1 percentage points to real GDP growth last
quarter following a 2.9 point addition during 2Q.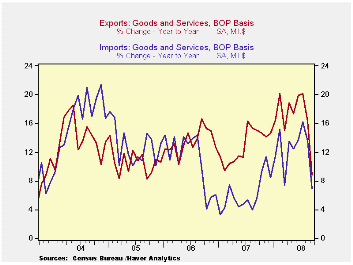
Lower oil prices helped imports shrink 5.6% after a 2.2% decline during August. Imports of all energy-related products fell 21.4% (+31.9% y/y) as the value of crude petroleum imports fell by more than one quarter. That drop owed to a decline in the average price per barrel of crude oil to $107.58 (+57.2% y/y) from a high of $124.7 in July. The developing U.S. recession prompted a 15.1% decline (-16.2% y/y) in the daily quantity of crude petroleum imports.
Recessionary forces were additionally evident in the 3.6% decline in the value of nonpetroleum imports. Measured in chained 2000 dollars nonoil imports fell 2.7% (-3.7% y/y), pulled lower by a 7.8% decline (-0.9% y/y) in real imports of nonauto consumer goods. The chained dollar value of imports of automotive vehicles & parts also fell by another 3.7% (-17.9% y/y). Real imports of nonauto capital goods reversed their August decline and rose 1.5% (0.9% y/y).
Services imports reversed past strength and fell 3.4% (+6.7%
y/y). Travel imports fell by 2.7% with the developing economic weakness
(+4.0% y/y) while passenger fares fell 3.9% (+5.8% y/y). Both of these
y/y increases are down sharply, from 12% for travel and from 20% for
passenger fares, as of early this year.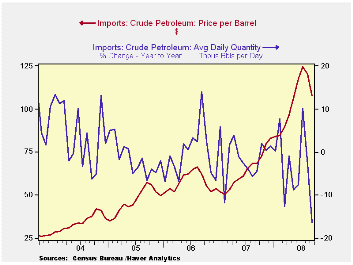
As economies abroad weakened exports fell by 6.0% (+8.8% y/y) during September. The decline reflected an 8.3% drop in goods exports. Adjusted for prices, chained dollar goods exports fell 7.8% (+2.3% y/y) led lower by a 9.6% (-0.8% y/y) drop in capital goods. Exports of autos & parts fell 1.4% (-2.0% y/y) after their 13.9% August plunge while real exports of nonauto consumer goods fell 3.3% (+4.7% y/y) on the heels of their 5.9% August drop. Adding to this weakness was a 10.8% (-5.4% y/y) drop in real exports of foods, feeds & beverages.
Nominal exports of services ticked 0.1% lower (+9.3% y/y) as travel exports fell 2.3% (+16.7% y/y). Passenger fares slipped 0.6% (+31.0% y/y). Exports of "other" private services have deteriorated markedly but ticked up 1.6% during September. Year-to-year growth fell to 4.7% after an 18.2% gain during all of last year.
The U.S. trade deficit in goods with China deepened to a record $27.8B and during the first nine months of this year averaged $21.7B versus $20.8B during the first nine months of 2007. Exports to China fell 18.2% last month (-5.1% y/y) after 18.2% growth during all of last year and imports rose 3.9% (12.5% y/y). The trade deficit with Japan deepened to $5.6B but during the first nine months of this year it is down to average of $6.3B from an average $6.8B during the first nine months of last year.
| Foreign Trade | September | August | Y/Y | 2007 | 2006 | 2005 |
|---|---|---|---|---|---|---|
| U.S. Trade Deficit | $56.5B | $59.1B | $55.5B (9/07) | $700.3 | $753.3 | $711.6B |
| Exports - Goods & Services | -6.0% | -1.7% | 8.8% | 13.0% | 13.5% | 10.6% |
| Imports - Goods & Services | -5.6% | -2.2% | 6.9% | 6.1% | 10.8% | 12.8% |
| Petroleum | -15.7% | -13.9% | 31.5% | 9.4% | 20.1% | 39.6% |
| Nonpetroleum Goods | -3.6% | 1.0% | 1.6% | 4.8% | 9.1% | 10.3% |
by Tom Moeller November 13, 2008
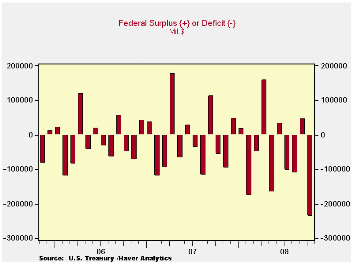
To start Fiscal Year 2009, the U.S. government's budget deficit for October reflected the duel of effects from a U.S. recession and the War in Iraq.The monthly deficit jumped to $237.2B, more than four times last year's deficit of $56.8B. October's figure also was more than double Consensus projections for a deficit of $99.2B.
Many forecasts for the budget deficit during all of this
fiscal year are near $700B. If realized, that would swell the deficit
to about 5% of GDP following last year's roughly 3.2% and FY07's
marginal 1.2%.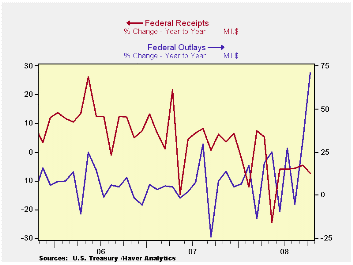
Net revenues during October suffered greatly and fell 7.5% from last year. Higher unemployment took the steam out of individual income tax receipts and they fell 9.7% from last October. Lingering payouts of the Government's "stimulus" checks reduced revenues somewhat. However the big negative factor would have been that payroll employment, and thus tax receipts, fell roughly 1.0% y/y. Suffering even more were corporate tax receipts which nearly evaporated with huge stated losses. Growth in unemployment and social insurance taxes grew a reduced 3.7%, the least since 2004.
U.S. government outlays nearly doubled versus last November lifted mostly by a jump in the "commerce & housing credit". Defense spending (19% of total outlays) rose an accelerated 17.9%. The gain does not reflect the full cost of the resources devoted to Iraq & Afghanistan since much of the spending would have occurred anyway. Medicare expenditures (12% of outlays) rose by nearly one-half but that followed an October decline Social security spending (21% of outlays) rose 6% after 6.8% growth last year. Net interest payments increased 4.3% y/y.
The Government's financial data are available in Haver's USECON database, with extensive detail available in the specialized GOVFIN.
| US Government Finance | October | September | Y/Y | FY 2008 | FY 2007 | FY 2006 |
|---|---|---|---|---|---|---|
| Budget Balance | -$237.2 | $45.7B | -$56.8B (10/07) |
-$454.8B | -$161.5B | -$248.2B |
| Net Revenues | $164.8B | $272.2B | -7.5% | -1.7% | 6.7% | 11.8% |
| Net Outlays | $402.0B | $226.5B | 71.1% | 9.1% | 2.8% | 7.4% |
by Tom Moeller November 13, 2008
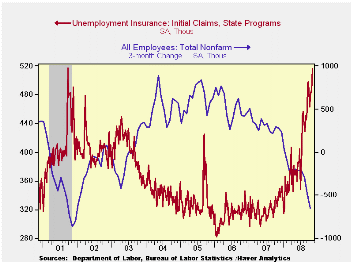
The weakening job market pushed initial claims for jobless insurance above 500,000 for the first time since they were briefly there; late during the recession of 2001 and just after the 9/11 terrorist attacks. At 516,000, claims rose last week from an upwardly revised reading of 484,000 during the prior period. Expectations had been for 479,000 claims. The four-week moving average of initial claims rose to this cycle's high of 491,000 (48.0% y/y).
The largest increases in initial claims for the week ending Nov. 1 were in Ohio (+3,885), Michigan (+2,619), Pennsylvania (+2,155), Wisconsin (+2,119), and Arizona (+1,692), while the largest decreases were in California (-3,603), Florida (-2,327), Nevada (-943), South Carolina (-824), and Indiana (-621).
Continuing claims for unemployment insurance during the week of November 1 rose another 65,000 after the prior week's 111,000 upward spurt. The four-week average of continuing claims rose to 3,794,000, this cycle's high and the highest since 1983. Continuing claims provide some indication of workers' ability to find employment and they lag the initial claims figures by one week.
The insured rate of unemployment rose to a new cycle high of 2.9%. The Commerce Department indicated that the highest insured unemployment rates in the week ending October 25 were in Puerto Rico (5.1 percent), Oregon (3.7), Nevada (3.6), Michigan (3.5), California (3.4), New Jersey (3.3), South Carolina (3.3), Pennsylvania (3.2), Arkansas (3.1), Alaska (3.0), and North Carolina (3.0).
| Unemployment Insurance (000s) | 11/08/08 | 11/01/08 | 10/25/08 | Y/Y | 2007 | 2006 | 2005 |
|---|---|---|---|---|---|---|---|
| Initial Claims | 516 | 484 | 485 | 52.7% | 322 | 313 | 331 |
| Continuing Claims | -- | 3,897 | 3,832 | 50.6% | 2,552 | 2,459 | 2,662 |
by Robert Brusca November 13, 2008
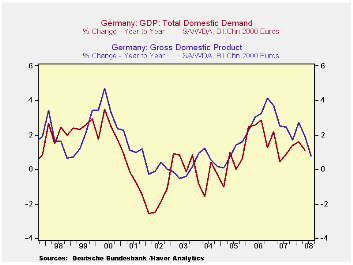
German GDP drops -German GDP drops by 2.1%
saar in 2008-Q3. As has been the case in Germany for sometime, the
Bundesbank continues to blame the thrust of events on outside forces.
Germany's Bundesbank said that the global growth slowdown was to blame
for Germany slipping into recession this year, after gross domestic
product data on Thursday showed that its economy shrank by 0.5 percent
in the third quarter of the year.
Germany as Victim: "National production in
Germany has significantly fallen in the summer ... compared to the
previous quarter. The broad global economic slowdown is now
increasingly making its presence felt," the German central bank said in
a statement.
Germany as free rider - There is no
disputing these facts but the Bundesbank does not point out that
Germany has an economy geared to exporting and one that therefore is
set to do better when the world economy does better and to do worse
when the world economy does worse. Blaming the world economy in this
circumstance is like the caboose blaming the engine for going too slow.
This arrangement is one that Germany has sought and has prospered under
in the past. Now that it is not working, it is not Germany’s fault.
Right.
Germany as braggart laggard - In the
chart at the top of this report notice that the RED German GDP line
usually exceeds the blue line. The red line is for all of GDP. The blue
line is for German domestic demand alone. Germany has been pulled ahead
by the global economy consistently since 2003. I don’t understand all
this complaining and the ongoing assertion of German superiority we
have been hearing from the Bundesbank, from the German finance ministry
and others. It has been about growth, the euro and German banks -
everything.
Giving or taking? No one forced German
banks to buy and hold the bad assets they have accumulated. Yet they
did that and suffered after the Bundesbank assured us that German banks
had no such problem. Germany is an intrinsically slow growing economy
with a high rate of unemployment. Its choice has been to accept that
and to seek growth through exports instead of though domestic means. At
a time that the US has had a big payments imbalance, and developing
countries were pursuing strategies of export-led growth, Germany would
have contributed to the world economy more by putting its unemployed to
work and by exporting less.
Global summit and blame: We are preparing for a global summit
where countries will sit across the table from one another and listen
to the pot calling the kettle black. Be sure that there will be a lot
of blaming and evading of blame at this G-20 meeting. But be clear that
as the center country in a currency system like this, if countries
choose a lower rate VS the dollar, they get it, and the US gets the
resulting deficit from trade.
What to fix: The currency monetary system is not set up to
encourage currencies to trade at their proper parities or to remedy
balance of payments imbalances when they arise. Breton Woods collapsed
because of disputes arising over payments imbalances and the US
tendency to grow faster than its trading partners (…and amass deficits
and lose gold reserves). And now some 35 years later these same root
differences are the nemesis of the Bretton Woods’ successor system of
fluctuating exchange rates. It’s not a matter of ‘is Germany better’
but rather ‘is it doing its share?’ Is it contributing to the world
order or is it adding to the burden or the excess? That is the real
question.
| German GDP | ||||||||
|---|---|---|---|---|---|---|---|---|
| Consumption | Capital Formation | Domestic | ||||||
| GDP | Private | Public | Total | Housing | Exports | Imports | Demand | |
| % change Q/Q; X-M is Q/Q change in Blns of euros | ||||||||
| Q3-08 | -2.1% | #N/A | #N/A | #N/A | #N/A | #N/A | #N/A | #N/A |
| Q2-08 | -1.7% | -2.6% | 1.2% | -2.0% | -13.5% | -0.6% | -5.3% | -4.1% |
| Q1-08 | 5.7% | -1.4% | 4.6% | 6.7% | 24.6% | 8.9% | 13.2% | 6.7% |
| Q4-07 | 1.4% | -0.8% | 0.2% | 16.0% | 1.6% | 5.2% | -1.2% | -1.7% |
| % change Yr/Yr; X-M is Yr/Yr change in Gap in Blns of euros | ||||||||
| Q3-08 | 0.8% | #N/A | #N/A | #N/A | #N/A | #N/A | #N/A | #N/A |
| Q2-08 | 1.9% | -0.9% | 1.9% | 6.5% | 3.0% | 5.1% | 4.2% | 1.1% |
| Q1-08 | 2.7% | 0.5% | 1.6% | 8.8% | 3.0% | 6.7% | 5.1% | 1.6% |
| Q4-07 | 1.7% | -1.3% | 2.0% | 8.3% | -2.7% | 3.2% | 2.7% | 1.4% |

Tom Moeller
AuthorMore in Author Profile »Prior to joining Haver Analytics in 2000, Mr. Moeller worked as the Economist at Chancellor Capital Management from 1985 to 1999. There, he developed comprehensive economic forecasts and interpreted economic data for equity and fixed income portfolio managers. Also at Chancellor, Mr. Moeller worked as an equity analyst and was responsible for researching and rating companies in the economically sensitive automobile and housing industries for investment in Chancellor’s equity portfolio. Prior to joining Chancellor, Mr. Moeller was an Economist at Citibank from 1979 to 1984. He also analyzed pricing behavior in the metals industry for the Council on Wage and Price Stability in Washington, D.C. In 1999, Mr. Moeller received the award for most accurate forecast from the Forecasters' Club of New York. From 1990 to 1992 he was President of the New York Association for Business Economists. Mr. Moeller earned an M.B.A. in Finance from Fordham University, where he graduated in 1987. He holds a Bachelor of Arts in Economics from George Washington University.
More Economy in Brief


