 Global| May 12 2009
U.S. Trade Deficit Remains Stable and Near Its Lowest Since 1999
by:Tom Moeller
|in:Economy in Brief
Summary
Though higher oil prices raised the cost of petroleum imports during March, the lift just slightly deepened the U.S. foreign trade deficit and it remained near the lowest level since 1999. The deficit of $27.6B deepened from the [...]
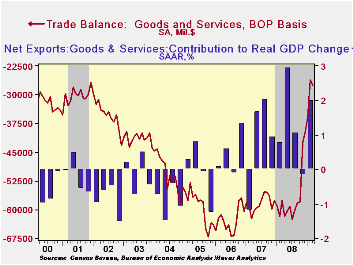
Though higher oil prices raised the cost of petroleum imports during March, the lift just slightly deepened the U.S. foreign trade deficit and it remained near the lowest level since 1999. The deficit of $27.6B deepened from the little revised February level of $26.1B. Imports remained down by one-quarter from last March due to the U.S. recession. Exports fell a lesser 17.4% y/y. Consensus expectations had been for a March deficit of $29.1B.
Adjusted for price inflation the trade deficit in goods also was roughly stable at $35.9B, the lowest since the 2001 recession. It was down from $47.6B last March.
A modest rise in crude oil costs to an average of $41.36 per
barrel still left them more than 50% lower than last March. Petroleum
imports retraced all of the February decline, rising 17.8%, while the
12.4% m/m rise in volume terms left real oil imports up just modestly
from last year.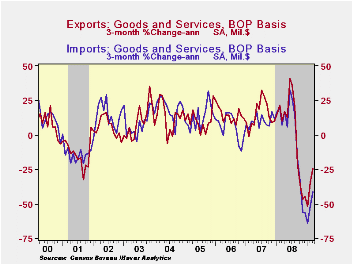
Measured in chained-2000 dollars nonoil imports fell a slight 0.9% (-22.0% y/y). Overall real non-auto consumer goods imports fell 12.5% y/y to their lowest level since early-2005. Imports of automotive vehicles & parts were down 48.3% y/y, while non-auto capital goods imports fell 22.8% y/y to their lowest since 2004.
Services imports fell another 1.0%, about as they did in February (-7.0% y/y), and are down for the seventh consecutive month. The decline reflected yet another decline in travel imports (-9.7% y/y) even as passenger fares dropped by 14.5% versus March of 2008.
Recessions abroad caused real exports of goods to reverse most of the February increase, falling 1.8%. The decline left them down 14.2% y/y, nearly the lowest level since late-2005. The chained dollar value of non-auto consumer goods exports reversed just some of the February increase with a 3.7% decline (-3.9% y/y). Capital goods exports were down a sharper 4.9% (-17.7% y/y) while real exports of automobiles & parts fell 4.1% (-39.3% y/y).
Nominal exports of services fell hard again. The 1.2% m/m
decline pulled them down by 6.8% y/y. Travel exports fell 15.5% y/y as
fewer foreign citizens came to the U.S. even as passenger fares fell
19.6%.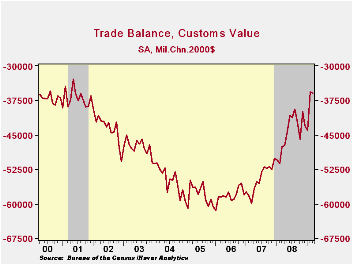
The U.S. trade deficit in goods with China deepened just slightly to $15.6B but remained near the lowest level since early-2006. Imports fell 5.5% y/y but U.S. exports fell a harder 12.3%. The trade deficit with Japan also deepened slightly to $2.6B but it remained near its shallowest since 1984. The U.S. recession drove down imports from Japan by roughly one-half from one year ago while exports fell by nearly one quarter.
The international trade data can be found in Haver's USECON database. Detailed figures are available in the USINT database.
The Supervisory Capital Assessment Program is yesterday's speech by Fed Chairman Ben S. Bernanke and it can be found here.
The Global Recession from the Federal Reserve Bank of St. Louis is available here.
| Foreign Trade | March | February | Y/Y | 2008 | 2007 | 2006 |
|---|---|---|---|---|---|---|
| U.S. Trade Deficit | $27.6B | $26.1B | $57.4B (03/08) | $681.1 | $700.3 | $753.3 |
| Exports - Goods & Services | -2.4% | 1.5% | -17.4% | 11.5% | 13.0% | 13.5% |
| Imports - Goods & Services | -1.0% | -5.1% | -27.0% | 7.3 | 6.1% | 10.8% |
| Petroleum | 3.1% | -8.4% | -51.1% | 37.0% | 9.4% | 20.1% |
| Nonpetroleum Goods | -1.7% | -5.4% | -25.0% | 1.3% | 4.8% | 9.1% |
by Robert Brusca May 12, 2009
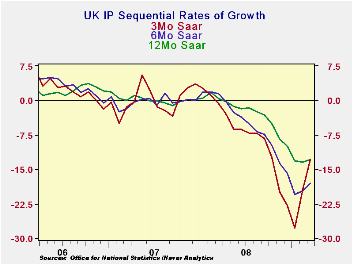
In the UK overall MFG output is flat in March. Despite the
fall, the output of durable consumer goods is up in March and its trend
shows a diminishing pace of decline. Consumer nondurable output is up
for three months in a row and sports an accelerating up-trend. For
intermediate goods the pace of decline is still fairly rapid and its
growth rate profile is more or less stuck at seriously negative rates
of growth. Capital goods remains as the most severely impacted sector
with decelerations in output growth still in place.
By detailed sector, food, drink and tobacco output is
accelerating and showing strong positive growth over three-months.
Textile and leather goods output has accelerated its decline over
three-months. Motor vehicles output is still dire with very strong
rates of negative growth. Mining activity has worsened over six months
then maintained that strong pace of decline. Overall utilities output
has been trimmed increasingly aggressively in recent months –a bad
overall sign.
While the UK does have some bright spots and the retail BRC
survey has produced a strong retail sales result for April, the UK
trends are still seriously troubled for industry. Signs of some
improvement in retailing and an increase in housing sentiment are
helpful since a consumer revival that stokes demand will lift output.
And while there are some encouraging signs from the consumer there is
little evidence so far that this is helping capital goods industries
much. The cessation of the drop in IP is good news. But the industrial
sector is caught between what seems to be some improvement by the
consumer amid still worsening conditions for capital goods. The nascent
improvement in the UK MFG PMI suggests that there may be some support
in the pipeline for the sector as a whole, however. Meanwhile the
up-turn in the three-month trend for IP itself also suggests that the
worst may be over. Industry remains seriously troubled, but this is
probably the beginning of a true turn for the UK economy.
| UK IP and MFG | ||||||||||
|---|---|---|---|---|---|---|---|---|---|---|
| Saar except m/m | Mo/Mo | Mar 09 |
Feb 09 |
Mar 09 |
Feb 09 |
Mar 09 |
Feb 09 |
|||
| UK MFG | Mar 09 |
Feb 09 |
Jan 09 |
3Mo | 3Mo | 6mo | 6mo | 12mo | 12mo | Q1- Date |
| MFG | 0.0% | -0.3% | -3.1% | -12.9% | -19.3% | -18.0% | -19.7% | -12.9% | -13.4% | -7.4% |
| Consumer | ||||||||||
| C-Durables | 0.7% | -0.6% | -4.8% | -17.6% | -30.8% | -26.4% | -27.0% | -19.4% | -21.5% | -7.9% |
| C-Non-durables | 0.8% | 0.8% | 0.5% | 9.2% | 3.4% | -0.6% | -4.2% | -3.0% | -4.4% | 9.8% |
| Intermediate | -1.1% | -1.3% | -3.7% | -21.8% | -23.7% | -23.4% | -21.1% | -14.7% | -14.0% | -17.7% |
| Capital | -1.5% | -1.4% | -5.1% | -27.9% | -29.5% | -26.0% | -25.3% | -17.7% | -16.5% | -22.6% |
| Memo: Detail | 1Mo% | 1Mo% | 1Mo% | 3Mo | 3Mo | 6mo | 6mo | 12mo | 12mo | Q1- Date |
| Food Drink&tobacco | 0.7% | 1.3% | 0.8% | 12.1% | 0.0% | -1.0% | -2.6% | -2.5% | -3.5% | 11.9% |
| Textile&Leather | -2.3% | -0.4% | -3.0% | -20.6% | -19.8% | -14.2% | -12.5% | -8.7% | -6.4% | -19.6% |
| Motor Vehicles & trailer | 5.0% | -4.8% | -18.5% | -55.8% | -64.9% | -58.9% | -64.8% | -42.8% | -46.1% | -29.4% |
| Mining and Quarry | -2.4% | -1.3% | -3.3% | -24.8% | -18.1% | -24.7% | -10.0% | -10.7% | -8.5% | -23.5% |
| Electricity, gas&H2O | -2.8% | -3.3% | -0.2% | -22.8% | -12.0% | -12.3% | -9.7% | -9.2% | -6.0% | -26.8% |
by Tom Moeller May 12, 2009
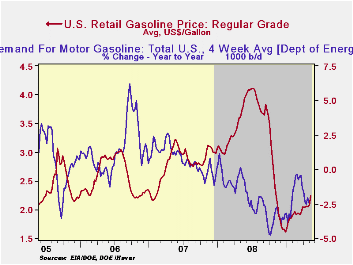
Regular gasoline prices last week continued their recent rise and settled at $2.24 per gallon last week. That price was up 63 cents (39.1%) from the December low and it was the highest level since November. Yesterday, cash market prices were higher still at $1.65 per gallon versus $1.59 averaged last week and it was the highest price since last October. The figures are reported by the U.S. Department of Energy and can be found in Haver's WEEKLY & Daily databases.
The gasoline price rise continues to reflect, in part, higher
crude oil prices. Prices averaged $56.00 last week for a
barrel of West Texas Intermediate, up $4.90 from the prior week and up
from the December low of $32.37 per barrel. Yesterday, crude oil prices
rose even further to $58.50. Prices reached a high of $145.66 last
July. The latest increases occurred despite a 3.9% rise in crude oil
production versus last year. The figures on crude oil production and
inventories are available in Haver's Weekly Oil Statistics
database.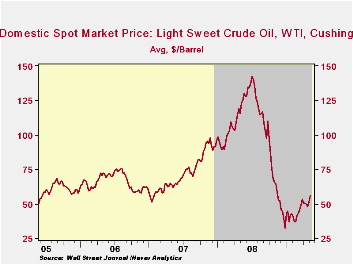
Higher gasoline prices and economic weakness have lowered miles-driven, though the rate of decline has eased. Gasoline demand last week fell 2.4% y/y versus the 4.8% rate of decline seen last October. The change in demand is measured using the latest four weeks versus the same four weeks in 2008. Demand for all petroleum products was down 7.9% y/y led by a 39.3% drop in demand for residual fuel oil and a 15.8% drop in distillate demand. The price gains have occurred despite an 11.7% rise in inventories of crude oil & petroleum products. These numbers are available in Haver's OILWKLY database.
The price of natural gas rose last week to $3.78 per mmbtu (-66.1% y/y) and it was the first w/w increase since March. Near the lowest level since 2002, the latest average price was down by three-quarters from the high reached in early-July of $13.19/mmbtu.
The Impact of Inflation and Unemployment on Subjective Personal and Country Evaluation from the Federal Reserve Bank of St. Louis is available here.
| Weekly Prices | 05/11/09 | 05/04/09 | Y/Y | 2008 | 2007 | 2006 |
|---|---|---|---|---|---|---|
| Retail Regular Gasoline ($ per Gallon, Regular) | 2.24 | 2.08 | -39.8% | 3.25 | 2.80 | 2.57 |
| Light Sweet Crude Oil, WTI ($ per bbl.) | 56.00 | 51.07 | -54.5% | 100.16 | 72.25 | 66.12 |
by Tom Moeller May 12, 2009
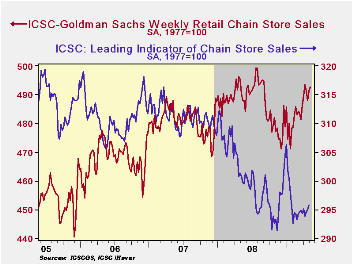
Despite the weakness in the job market, the consumer continues to visit shopping centers putting chain store sales on a firmer footing. According to the International Council of Shopping Centers-Goldman Sachs Index store sales rose another 0.3% last week after the prior week's 0.7% increase. For the month so far, chain store sales are up 0.3% from April after that month's 1.4% rise from the March average.
During the last ten years there has been a 64% correlation between the year-to-year growth in chain store sales and the growth in general merchandise sales. These weekly figures are available in Haver's SURVEYW database.
The ICSC-Goldman Sachs retail chain-store sales index is constructed using the same-store sales (stores open for one year) reported by 78 stores of seven retailers: Dayton Hudson, Federated, Kmart, May, J.C. Penney, Sears and Wal-Mart.
The gains in sales occurred as the outlook brightened. The leading indicator of sales moved to its highest level since January. The year-to-year change has improved to a negative 1.8%, up from the 6% rate of decline last Fall.
Lending Standards in Mortgage Markets from the Federal Reserve Bank of St. Louis can be found here.
| ICSC-UBS (SA, 1977=100) | 05/09/09 | 05/02/09 | Y/Y | 2008 | 2007 | 2006 |
|---|---|---|---|---|---|---|
| Total Weekly Chain Store Sales | 492.7 | 491.3 | 0.5% | 1.4% | 2.8% | 3.3% |
by Tom Moeller May 12, 2009
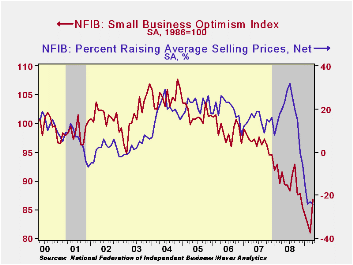
According to the National Federation of Independent Business (NFIB), small business optimism recovered sharply last month. The index level of 86.8 was its highest level since last November. However, despite the increase business were far from ebbulient and the index was down 5.1% year-to-year.
During the last ten years there has been a 49% correlation
between the level of the NFIB index and the two-quarter change in real
GDP.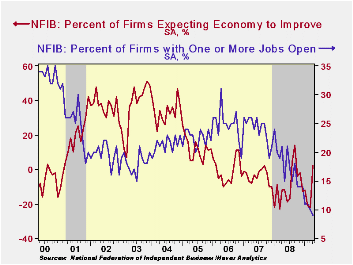
The latest rise in the index occurred as the percentage expecting the economy to improve jumped to 2% after spending several months in negative territory. Also jumping sharply was the percentage expecting credit conditions to ease while the percentage reporting that now is a good time to expand the business rose to its highest since January. During the next 3-6 months, plans for capital spending actually improved to the highest level since January.
The percentage planning to raise employment made up a sharp March decline but remained a net negative 5%. However, the percentage of respondents with one or more job openings fell to a new low for the series of 9%, the least since 1982. During the last ten years there has been a 71% correlation between the NFIB employment percentage and the y/y change in nonfarm payrolls.
The largest, single most important problems seen by business were poor sales (32%), taxes (22%), government requirements (11%), insurance cost and availability (8%), competition from large businesses (6%) and inflation (4%).
The percentage of firms planning to raise prices ticked up to 1%, near the record low. Price discounts were evident as the percentage of firms actually raising prices fell further into negative territory, and the reading was a record low. During the last ten years there has been a 69% correlation between the y/y change in the producer price index and the level of the NFIB price index.
About 24 million businesses exist in the United States. Small business creates 80% of all new jobs in America.
The NFIB figures can be found in Haver's SURVEYS database.
| Nat'l Federation of Independent Business | April | Marh | Y/Y | 2008 | 2007 | 2006 |
|---|---|---|---|---|---|---|
| Small Business Optimism Index (SA, 1986=100) | 86.8 | 81.0 | -5.1% | 89.8 | 96.7 | 98.9 |

Tom Moeller
AuthorMore in Author Profile »Prior to joining Haver Analytics in 2000, Mr. Moeller worked as the Economist at Chancellor Capital Management from 1985 to 1999. There, he developed comprehensive economic forecasts and interpreted economic data for equity and fixed income portfolio managers. Also at Chancellor, Mr. Moeller worked as an equity analyst and was responsible for researching and rating companies in the economically sensitive automobile and housing industries for investment in Chancellor’s equity portfolio. Prior to joining Chancellor, Mr. Moeller was an Economist at Citibank from 1979 to 1984. He also analyzed pricing behavior in the metals industry for the Council on Wage and Price Stability in Washington, D.C. In 1999, Mr. Moeller received the award for most accurate forecast from the Forecasters' Club of New York. From 1990 to 1992 he was President of the New York Association for Business Economists. Mr. Moeller earned an M.B.A. in Finance from Fordham University, where he graduated in 1987. He holds a Bachelor of Arts in Economics from George Washington University.
More Economy in Brief


