 Global| May 11 2005
U.S. Trade Deficit Posted Surprising Improvement
by:Tom Moeller
|in:Economy in Brief
Summary
The U.S. foreign trade deficit improved unexpectedly in March to $55.0B from the little revised record of $60.6B in February. Consensus expectations had been for a $61.5B deficit. Total exports jumped 1.5% following two months of [...]
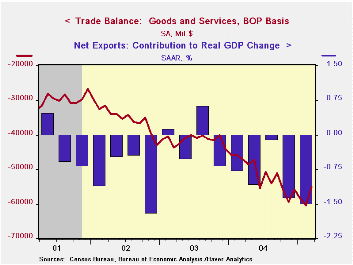
The U.S. foreign trade deficit improved unexpectedly in March to $55.0B from the little revised record of $60.6B in February. Consensus expectations had been for a $61.5B deficit.
Total exports jumped 1.5% following two months of little change. Goods exports surged 1.4% (6.9% y/y) on the strength of a 6.6% increase in foods, feeds & beverages and a 3.3% (4.7% y/y) rise in capital goods. Exports of advanced technology products jumped 31.3% (NSA, +2.9% y/y).
In other categories export performance paled. Exports of non-auto consumer goods were unchanged (9.8% y/y) after a 3.1% spike in February and automotive exports fell 1.2% (+7.0% y/y), down for the second month.
Services exports rose 1.8% (7.7% y/y) as passenger fares jumped 3.9% 14.5% y/y) and spending on travel surged 2.8% (10.8% y/y).
Total imports slumped 2.5% despite a 4.1% (32.4% y/y) rise in petroleum products. The average price of crude oil surged 11.6% to $41.14 per bbl. (34.3% y/y). Imports of non-petroleum goods fell 4.6% (+4.7% y/y) as capital goods imports fell 1.1% (+8.3% y/y) for the second monthly decline and nonauto consumer goods imports plunged 6.8% (+4.5% y/y).
The US trade deficit with China improved for the second month to $12.9B ($162.0B in 2004) as exports surged (-2.0% y/y) and imports fell (+17.4% y/y). The US trade deficit with Japan deepened further to $7.8B ($75.2B in 2004) but the monthly trade deficit with the Asian NICs nearly dissolved ($21.9B in 2004) due to a 22.1% surge in exports (3.8% y/y). The US trade deficit with the European Union deepened to $9.3B ($110.0B in 2004), the result of an 11.7% jump in imports (+1.0% y/y) which outpaced a 12.7% (4.8% y/y) rise in exports.
Are We Underestimating the Gains from Globalization for the United States? from the Federal Reserve Bank of New York is available here.
The Evolution and Implications of the U.S. Current Account Deficit from the Federal Reserve Bank of Atlanta can be found here.
Unwinding the Current Account Deficit from the Federal Reserve Bank of St. Louis can be viewed here.
| Foreign Trade | Mar | Feb | Y/Y | 2004 | 2003 | 2002 |
|---|---|---|---|---|---|---|
| Trade Deficit | $55.0.0B | $60.6B | $47.1B (3/04) | $617.1B | $496.5B | $421.7B |
| Exports - Goods & Services | 1.5% | 0.2% | 7.1% | 12.4% | 4.6% | -3.1% |
| Imports - Goods & Services | -2.5% | 1.5% | 10.3% | 16.3% | 8.5% | 2.1% |
by Tom Moeller May 11, 2005
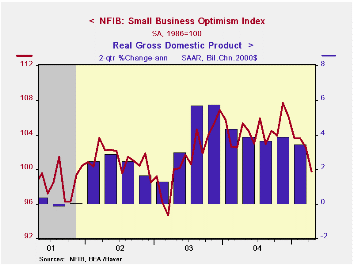
The Small Business Optimism Index reported by the National Federation of Independent Business (NFIB) fell another 2.6% in April and is off 7.3% from the peak last November. The decline occurred as the percentage of firms expecting the economy to improve collapsed to 5% versus 47% in November.
During the last ten years there has been a 64% correlation between the level of the NFIB index and the two quarter change in real GDP.
The job outlook brightened only slightly. The percentage of firms planning to raise employment rose one point to 11% but was half the 20% of December 2003. A brighter job market picture came from the percentage of firms with one or more job openings at 23% which was well up from the low of 15% during 2003. During the last ten years there has been a 67% correlation between hiring plans and the three month growth in nonfarm payrolls.
The percentage of firms planning to raise capital spending slid to 32%, well off from the 38% this past December.
The percentage of firms raising average selling prices slipped to 23%.
About 24 million businesses exist in the United States. Small business creates 80% of all new jobs in America.
| Nat'l Federation of Independent Business | April | Mar | Y/Y | 2004 | 2003 | 2002 |
|---|---|---|---|---|---|---|
| Small Business Optimism Index (1986=100) | 99.8 | 102.5 | -5.3% | 104.6 | 101.3 | 101.2 |
by Tom Moeller May 11, 2005
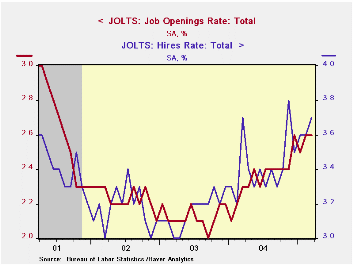
The Job Openings & Labor Turnover Survey (JOLTS) from the Bureau of Labor Statistics indicated that the job openings rate held firm at 2.6% versus an upwardly revised level in February. The job openings rate is the number of job openings on the last business day of the month as a percent of total employment plus job openings. The total number of job openings was about stable m/m but up 14.9% y/y.
The March hires rate continued the trend of improvement and rose to 3.7%. The hires rate is the number of hires during the month divided by employment.
Job separations rose and reversed most of the decline during the prior two months. The separation rate rose to 3.3%. Total separations include quits, layoffs, discharges, and other separations as well as retirements. The total separations, or turnover, rate is the total number of separations during the month divided by employment.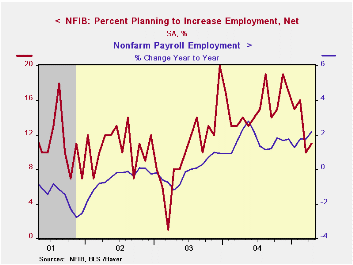
The survey dates only to December 2000 but has since followed the movement in nonfarm payrolls.
A description of the Jolts survey and the latest release from the U.S. Department of Labor is available here.
| JOLTS (Job Openings & Labor Turnover Survey) | Mar | Feb | Mar '04 | 2004 | 2003 | 2002 |
|---|---|---|---|---|---|---|
| Job Openings Rate: Total | 2.6% | 2.6% | 2.3% | 2.4% | 2.1% | 2.2% |
| Hires Rate: Total | 3.7% | 3.6% | 3.7% | 3.4% | 3.2% | 3.2% |
by Tom Moeller May 11, 2005
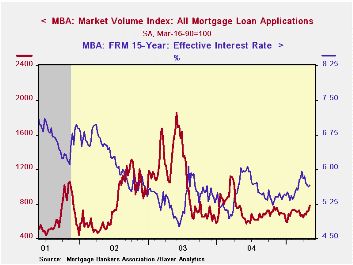
Total mortgage applications jumped 9.4% last week according to the Mortgage Bankers Association and began the month 13.9% ahead of the depressed April average.
Applications to purchase a home jumped 9.1% w/w and started May 11.9% ahead of April. During the last ten years there has been a 50% correlation between the y/y change in purchase applications and the change in new plus existing single family home sales.
Applications to refinance rose 9.8%.
The effective interest rate on a conventional 30-year mortgage ticked up to 6.02% from 5.98% but remained down from the high of 6.34% in late March. The effective rate on a 15-year mortgage was 5.65%.
The Mortgage Bankers Association surveys between 20 to 35 of the top lenders in the U.S. housing industry to derive its refinance, purchase and market indexes. The weekly survey accounts for more than 40% of all applications processed each week by mortgage lenders. Visit the Mortgage Bankers Association site here.
| MBA Mortgage Applications (3/16/90=100) | 05/06/05 | 04/29/05 | Y/Y | 2004 | 2003 | 2002 |
|---|---|---|---|---|---|---|
| Total Market Index | 781.0 | 714.1 | 5.2% | 735.1 | 1,067.9 | 799.7 |
| Purchase | 526.2 | 482.5 | 6.5% | 454.5 | 395.1 | 354.7 |
| Refinancing | 2,263.3 | 2,061.2 | 3.6% | 2,366.8 | 4,981.8 | 3,388.0 |
by Carol Stone May 11, 2005
The surprising reduction in the US trade deficit for March begs for comparison with trade data reported today by other major countries. We've highlighted here the role of energy in two oil-producing nations, the UK and Canada, along with the US. In the US, the petroleum deficit continued to widen, but modestly, while the non-petroleum deficit fell sharply in the month, as described by Tom Moeller in the Haver.com homepage commentary for today.
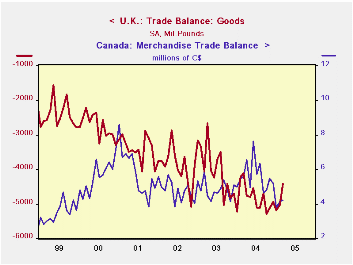
In the UK, the overall trade deficit decreased to £4.4 billion in March from £5.1 billion in February. The non-oil deficit also decreased, but just slightly, reflecting a 1.8% rise in non-oil exports after two successive monthly declines. The oil surplus in the UK is marginal, and in some months, oil even runs a small deficit. The non-oil deficit had widened fairly consistently from 1997 through the middle of last year and has since begun to diminish gradually, as import growth has tended to slow.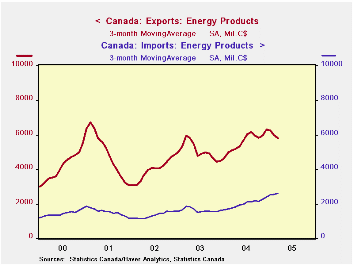
Canada's trade balance was C$4.235 billion in March, up from C$4.155 billion in February. The energy surplus is drifting down a little, with the March value, C$3.4 billion, off from the 2004 average of C$3.7 billion. Exports of energy products have flattened in the last six month, but energy imports are trending upward, as seen in the second graph. The surplus in non-energy trade has fallen more distinctly with a modest slowing of those exports.
In both the US and the UK, non-energy imports have recently turned down. For the US, this is just a one-month development and could easily be reversed, but in the UK, March was the third month. Possibly the weight of energy on these economies is starting to restrain other purchasing from abroad. This is an important development to monitor.
| Millions of Local Currency, Seasonally Adjusted |
Mar 2005 | Feb 2005 | Mar 2004 | Monthly Average|||
|---|---|---|---|---|---|---|
| 2004 | 2003 | 2002 | ||||
| UK: Balance on Goods | -4,412 | -5,037 | -4,108 | -4,829 | -3,972 | -3,890 |
| Balance on Oil | 384 | 44 | 193 | 163 | 344 | 478 |
| Balance ex Oil | -4,796 | -5,081 | -4,519 | -4,992 | -4,316 | -4,368 |
| Canada: Balance on Goods | 4,235 | 4,155 | 5,584 | 5,602 | 4,848 | 4,768 |
| Balance on Energy | 3,386 | 3,053 | 3,164 | 3,693 | 3,406 | 2,738 |
| Balance ex Energy | 849 | 102 | 2,420 | 1,909 | 1,442 | 2,030 |
| US: Balance on Goods | -57,171 | -63,538 | -50,026 | -54,234 | -44,362 | -39,022 |
| Balance on Petroleum | -16,992 | -16,343 | -13,013 | -13,653 | -10,034 | -7,764 |
| Balance ex Petroleum | -41,179 | -47,195 | -37,013 | -40,582 | -34,329 | -31,258 |

Tom Moeller
AuthorMore in Author Profile »Prior to joining Haver Analytics in 2000, Mr. Moeller worked as the Economist at Chancellor Capital Management from 1985 to 1999. There, he developed comprehensive economic forecasts and interpreted economic data for equity and fixed income portfolio managers. Also at Chancellor, Mr. Moeller worked as an equity analyst and was responsible for researching and rating companies in the economically sensitive automobile and housing industries for investment in Chancellor’s equity portfolio. Prior to joining Chancellor, Mr. Moeller was an Economist at Citibank from 1979 to 1984. He also analyzed pricing behavior in the metals industry for the Council on Wage and Price Stability in Washington, D.C. In 1999, Mr. Moeller received the award for most accurate forecast from the Forecasters' Club of New York. From 1990 to 1992 he was President of the New York Association for Business Economists. Mr. Moeller earned an M.B.A. in Finance from Fordham University, where he graduated in 1987. He holds a Bachelor of Arts in Economics from George Washington University.
More Economy in Brief


