 Global| Feb 14 2008
U.S. Trade Deficit Narrowed Sharply
by:Tom Moeller
|in:Economy in Brief
Summary
The U.S. foreign trade deficit in December narrowed sharply to $58.8B from an unrevised $63.1B during November. The figure compared to Consensus expectations for a deficit of $61.4B and it pulled the annual deficit for 2007 to [...]
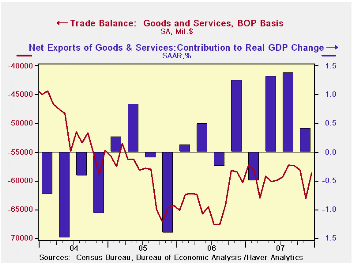
The U.S. foreign trade deficit in December narrowed sharply to $58.8B from an unrevised $63.1B during November. The figure compared to Consensus expectations for a deficit of $61.4B and it pulled the annual deficit for 2007 to $771.6B, its lowest since 2004.
For December U.S. exports jumped 1.5%, the largest monthly increase since July. Strong economies abroad and the lower value of the dollar helped exports during all of last year to rise 12.2% after a 12.7% gain in 2006 and a 10.9% rise in 2005.
Exports of goods surged 1.9% in December (14.5% y/y) and for
the full year rose 12.2%. Growth in exports of foods, feeds &
beverages slipped 1.7% in December but for the year this was the
strongest export category with a 27.7% rise. Exports of industrial
supplies & materials also were strong last year and rose 14.3%.
During December exports of capital goods surged 5.2% to finish a year
of 7.8% growth after a 14.2% jump in 2006. Exports of civilian aircraft
rose 20.8% during all of last year while exports of computers jumped
18.3%.Nonauto consumer goods exports also were strong in December. They
rose 4.6% and were firm all year with a 12.6% increase. That was
similar to the gains during the prior three years.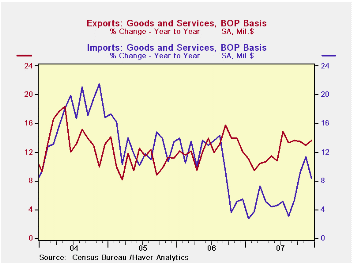
U.S. exports of services slipped 0.3% in December but finished a year of 11.8% growth. That annual gain was paced by 14.1% growth in travel exports and a 12.1% rise in passenger fares.
Overall imports fell 1.1% in December and the annual gain of 5.9% was the weakest since 2002. Higher oil prices did raise petroleum imports by 4.2% in December and by 9.5% for the year, however, that was the weakest annual rise since 2002. Petroleum imports in constant dollars fell as the per barrel price of crude petroleum rose 11.1% for the year. That followed price gains of 23.2% in 2006 and of 36.3% in 2005. Imports of nonauto consumer goods rose 7.3% last year, the weakest gain since 2001 and capital goods imports increased 6.3% for the year, the weakest gain since 2003.
The U.S. trade deficit in goods with China during 2007 deepened to $25.6B from $23.3B. Imports rose 11.7% and exports rose 18.2%, the weakest rise since 2002.
The Economy and Financial Markets is today's testimony by Fed Chairman Ben S. Bernanke and it is available here.
Today's speech by Treasury Secretary Henry M. Paulson, Jr., Economy and Financial Markets, can be found here.
| Foreign Trade | December | November | Y/Y | 2007 | 2006 | 2005 |
|---|---|---|---|---|---|---|
| U.S. Trade Deficit | $58.8B | $63.1B | $60.3B (12/06) |
$711.6 | $758.5 | $714.4B |
| Exports - Goods & Services | 1.5% | 0.5% | 13.6% | 12.2% | 12.7% | 10.9% |
| Imports - Goods & Services | -1.1% | 2.9% | 8.4% | 5.9% | 10.4% | 12.9% |
| Petroleum | 4.2% | 16.3% | 52.4% | 9.5% | 20.1% | 39.6% |
| Nonpetroleum Goods | -2.8% | 0.9% | 0.5% | 4.6% | 9.1% | 10.3% |
by Tom Moeller February 14, 2008
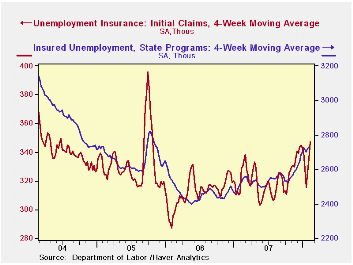
Initial claims for jobless insurance slipped another 9,000 to 348,000 last week after the prior week's 21,000 decline. For February, claims so far are up 26,000, or 8.0%, from the January average. The latest weekly level remained near the highest since October of 2005.
The four-week moving average of initial claims, a measure which smoothes out most of the series' w/w volatility, rose again to 347,250 (+5.6% y/y), the highest level since late 2005.
A claims level below 400,000 typically has been associated with growth in nonfarm payrolls. During the last ten years there has been a (negative) 76% correlation between the level of initial claims and the m/m change in nonfarm payroll employment.
Continuing claims for unemployment insurance slipped 9,000 after a downwardly revised jump of 60,000 during the prior week. The figure provides some indication of workers' ability to find employment but here again difficulties of seasonal adjustment this time of year are great.
The continuing claims numbers lag the initial claims figures by one week.
The insured rate of unemployment held at 2.1% for the second week.
Business Volatility, Job Destruction and Unemployment from the Federal Reserve Bank of San Francisco can be found here.
A Minimum Wager from the Federal Reserve Bank of Minneapolis is available here.
| Unemployment Insurance (000s) | 02/08/08 | 02/01/07 | Y/Y | 2006 | 2005 | 2004 |
|---|---|---|---|---|---|---|
| Initial Claims | 348 | 357 | -2.2% | 313 | 331 | 343 |
| Continuing Claims | -- | 2,761 | 8.3% | 2,459 | 2,662 | 2,924 |
by Tom Moeller February 14, 2008
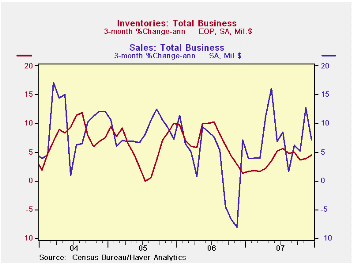
The latest figures from the Commerce Department indicate that
total business inventory accumulation in December of 0.6% followed a
0.4% November rise. The three month change in inventories of 4.5% (AR)
was down from a 4.9% rate of accumulation during 3Q. The deceleration
was not, however, quite as drastic as indicated by the 1.2 percentage
point subtraction inventories made from economic growth, indicated in
the advance read of 4Q GDP.
Retail inventories fell 0.1% during December following a
revised 0.3% November decline. Inventories of motor vehicles
fell 1.6% in December and the three month change swung to -8.2% (AR)
from an 18.5% rate of accumulation during 3Q. Inventories excluding
autos rose 0.7% in December (3.2% y/y) and the rate of accumulation
last quarter nearly tripled that in 3Q.
The acceleration was due to building materials which grew 0.3% in December but rose at a 6.8% rate in 4Q versus a 1.4% rate of decline during 3Q. Furniture inventories fell 0.5% (+4.8% y/y) after a 0.9% November drop and the three month change fell to 2.8% (AR) from 10.4% in 3Q. At clothing & accessory stores December inventories rose 0.5% after two months of modest decline. The three month rate held steady last quarter with 3Q at roughly unchanged. Inventories at general merchandise stores rose 0.9% in December and recouped about half of a November decline. For the quarter decumulation held steady with 3Q at a 2.5% rate.
Wholesale inventories jumped 1.1% after a 0.8% November surge. Petroleum inventories skyrocketed 9.2%, more than double the November rise. Less petroleum wholesale inventories rose 0.9% but the three month change fell to 5.3% (AR) from 7.4% during 3Q. During the last ten years there has been a 59% correlation between the annual change in wholesale inventories les petroleum and the change in merchandise imports.
Factory inventories increased 0.8% after a firm 0.7% rise during November. The three month growth in factory inventories accelerated to 6.7% from 2.5% during 3Q. Some of that acceleration owed to petroleum refineries, but excluding petroleum factory inventories still rose 5.8% (AR), nearly triple the 3Q rise.
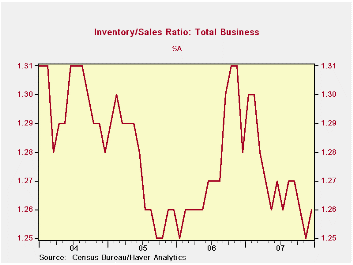
Business sales fell 0.5% (+6.0% y/y) due to declines in wholesale sales and factory shipments. The decline lifted the ratio of inventories to sales off its lowest level since early 2006.
| Business Inventories | December | November | Y/Y | 2007 | 2006 | 2005 |
|---|---|---|---|---|---|---|
| Total | 0.6% | 0.4% | 4.0% | 4.0% | 5.8% | 6.2% |
| Retail | -0.1% | -0.3% | 2.9% | 2.9% | 3.2% | 2.8% |
| Retail excl. Autos | 0.7% | -0.4% | 3.2% | 3.2% | 4.5% | 4.5% |
| Wholesale | 1.1% | 0.8% | 6.1% | 6.1% | 8.5% | 7.4% |
| Manufacturing | 0.8% | 0.7% | 3.6% | 3.6% | 6.4% | 8.9% |
by Robert Brusca February 14, 2008
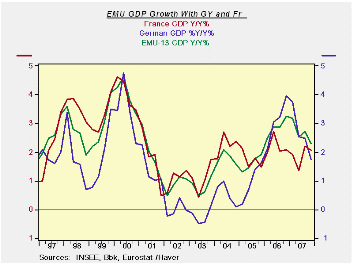
GDP growth is slowing on a broad front. German GDP is slowing year/year for four straight quarters. For most other countries Q3 growth brought an up tick that quarter and interrupted what would have been similar long strings of GDP deceleration. GDP growth year/year in 2007-Q4 slowed everywhere except in the Netherlands. Quarter-to-quarter GDP growth rates slowed everywhere except Japan.
With the European releases on GDP we have no detail on GDP, except for France. There weaker consumption and inventory reduction brought GDP growth lower. We have seen the reduction in the growth rates of the industrial sectors in recent months even though some of the industrial indicators have displayed some firmer signals. The EU sentiment indexes have marked this slowdown correctly.
The fact of the matter is that GDP here and now is slowing. The recent rhetoric of the ECB is sounding much less certain and much more like it is about to really keep its options open. Remember that when the credit problems hit in the US at first the Fed did not think that they would be so bad. Now UBS, a large Swiss bank, has just reported larger subprime losses than expected and more exposure to leverage type loans of the variety that have fallen into disregard.
German unions (IG Metall) are using feisty rhetoric to justify pay hikes even saying that ECB is wrong and that policy should be accommodative. Professional EMU forecasters (see ECB survey) now look for weaker growth and more inflation in the Euro Area. Eurogroup Chairman Jean-Claude Juncker has admitted that the situation is ‘not completely clear any more’. Guy Quaden, ECB council member, has said that the economy could decelerate faster than the ECB previously thought. All of this suggests a situation, outlook and policy in flux.
| Euro Area and Main G-10 Country GDP Results | |||||||
|---|---|---|---|---|---|---|---|
| Quarter over quarter | Year/Year | ||||||
| GDP | Q4-07 | Q3-07 | Q2-07 | Q4-07 | Q3-07 | Q2-07 | Q1-07 |
| EMU-13 | 1.7% | 3.1% | 1.2% | 2.3% | 2.7% | 2.5% | 3.2% |
| France | 1.4% | 3.2% | 1.4% | 2.1% | 2.2% | 1.3% | 1.9% |
| Germany | 1.1% | 2.7% | 0.7% | 1.7% | 2.5% | 2.6% | 3.7% |
| Italy | -- | 1.7% | 0.2% | -- | 1.9% | 1.8% | 2.4% |
| The Netherlands | 4.7% | 7.7% | 1.1% | 4.3% | 3.9% | 2.4% | 3.2% |
| UK | 2.5% | 2.5% | 3.3% | 2.9% | 3.2% | 3.2% | 3.2% |
| US | 0.6% | 4.9% | 3.8% | 2.5% | 2.8% | 1.9% | 1.5% |
| Japan | 3.7% | 1.3% | -1.4% | 1.8% | 1.9% | 1.7% | 2.9% |

Tom Moeller
AuthorMore in Author Profile »Prior to joining Haver Analytics in 2000, Mr. Moeller worked as the Economist at Chancellor Capital Management from 1985 to 1999. There, he developed comprehensive economic forecasts and interpreted economic data for equity and fixed income portfolio managers. Also at Chancellor, Mr. Moeller worked as an equity analyst and was responsible for researching and rating companies in the economically sensitive automobile and housing industries for investment in Chancellor’s equity portfolio. Prior to joining Chancellor, Mr. Moeller was an Economist at Citibank from 1979 to 1984. He also analyzed pricing behavior in the metals industry for the Council on Wage and Price Stability in Washington, D.C. In 1999, Mr. Moeller received the award for most accurate forecast from the Forecasters' Club of New York. From 1990 to 1992 he was President of the New York Association for Business Economists. Mr. Moeller earned an M.B.A. in Finance from Fordham University, where he graduated in 1987. He holds a Bachelor of Arts in Economics from George Washington University.
More Economy in Brief


