 Global| Jan 12 2006
U.S. Trade Deficit Narrowed as Oil Prices Fell
by:Tom Moeller
|in:Economy in Brief
Summary
The U.S. foreign trade deficit in November narrowed to $64.2B from the record $68.1B the prior month which was revised slightly shallower from the initial estimate. Consensus expectations had been for a narrowing to $66.1B. Imports of [...]
The U.S. foreign trade deficit in November narrowed to $64.2B from the record $68.1B the prior month which was revised slightly shallower from the initial estimate. Consensus expectations had been for a narrowing to $66.1B.
Imports of petroleum products reversed about half of the prior month's gain with a 3.1% decline. The drop was wholly due to lower prices. The per barrel price of crude oil dropped 7.3% (+26.6% y/y) to $52.16 but the per day volume of crude oil imports rose 6.7% (-4.6% y/y). In December, crude oil prices backed up to roughly $53.50 but in January have risen another $5.00 per barrel. 
A 1.1% (+8.3% y/y) decline in imports of nonpetroleum products reversed much of the October increase. Imports of nonauto consumer goods fell 3.1% (+2.6% y/y) and capital goods imports slipped 0.1% (+8.1% y/y). Imports of advanced technology products were unchanged (NSA, 8.1% y/y) following several months of strong gain.
Total exports rose strongly for the third of the last four months. The 1.8% increase was led by a 3.7% (16.1% y/y) jump in capital goods. Exports of advanced technology products added 0.4% (NSA, 16.5% y/y) to the 10.4% spike in October. Consumer goods exports also reversed the prior month's weakness and surged 6.2% (12.3% y/y).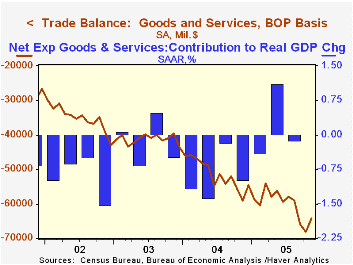
Services exports fell moderately for the second consecutive month. The 0.7% (+6.4% y/y) decline owed to a 2.5% (+6.4% y/y) decline in private travel and a 3.5% (+8.2% y/y) drop in passenger fares. Imports of services rose 0.5% (5.8% y/y) as passenger fares rose 1.6% (4.6% y/y) but travel fell 1.3% (+0.1% y/y). Travel imports have fallen 9.8% since the peak in April.
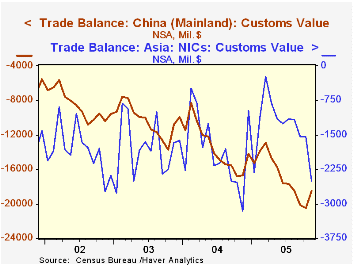
The US trade deficit with China improved to $18.5B ($161.9B in 2004) from the record deficit in October. The US trade deficit with Japan also improved very slightly m/m to $7.3B ($75.6B in 2004) but the monthly trade deficit with the Asian NICs deepened sharply to $2.5B ($21.9B in 2004). The deficit with the European Union improved $11.2B ($109.3B in 2004) from the record of $12.1n October.
What Determines Bilateral Trade Flows? from the Federal Reserve Bank of Chicago can be found here.
| Foreign Trade | Nov | Oct | Y/Y | 2004 | 2003 | 2002 |
|---|---|---|---|---|---|---|
| Trade Deficit | $64.2B | $68.1B | $59.0B (11/04) | $617.6B | $494.8B | $421.2B |
| Exports - Goods & Services | 1.8% | 1.5% | 10.8% | 12.6% | 4.6% | -3.0% |
| Imports - Goods & Services | -1.1% | 2.2% | 10.1% | 16.6% | 8.5% | 2.1% |

Tom Moeller
AuthorMore in Author Profile »Prior to joining Haver Analytics in 2000, Mr. Moeller worked as the Economist at Chancellor Capital Management from 1985 to 1999. There, he developed comprehensive economic forecasts and interpreted economic data for equity and fixed income portfolio managers. Also at Chancellor, Mr. Moeller worked as an equity analyst and was responsible for researching and rating companies in the economically sensitive automobile and housing industries for investment in Chancellor’s equity portfolio. Prior to joining Chancellor, Mr. Moeller was an Economist at Citibank from 1979 to 1984. He also analyzed pricing behavior in the metals industry for the Council on Wage and Price Stability in Washington, D.C. In 1999, Mr. Moeller received the award for most accurate forecast from the Forecasters' Club of New York. From 1990 to 1992 he was President of the New York Association for Business Economists. Mr. Moeller earned an M.B.A. in Finance from Fordham University, where he graduated in 1987. He holds a Bachelor of Arts in Economics from George Washington University.
More Economy in Brief


