 Global| May 11 2011
U.S. Trade Deficit Increases With Higher Oil Prices
by:Tom Moeller
|in:Economy in Brief
Summary
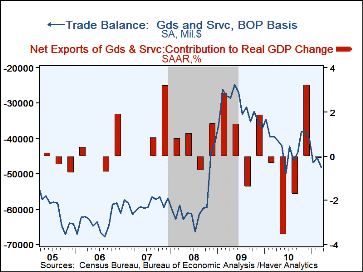
Higher oil prices acted to deepen the U.S. trade deficit to its widest since last June. The foreign trade deficit increased in March to $48.2B versus $45.4B in February, revised from $45.8B reported initially. Expectations had been [...]
Higher oil prices acted to deepen the U.S. trade deficit to its widest since last June. The foreign trade deficit increased in March to $48.2B versus $45.4B in February, revised from $45.8B reported initially. Expectations had been for $47.0B according to Action Economics. Exports rose 4.6% following a 1.5% February decline. Imports increased 4.9%. In chained 2005 dollars, the overall deficit in goods deteriorated to $50.1B from $49.3B in February.
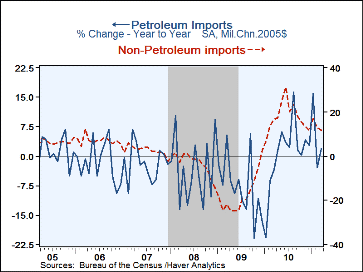
The primary factor causing last month's deficit deterioration was an 18.0% m/m jump (30.1% y/y) in petroleum imports driven by higher prices. Petroleum import volumes rose a lesser 8.8% (1.9% y/y). The per barrel cost of crude oil increased to $93.76 from $87.17 in February. Twelve months earlier, prices averaged $74.32. The total value of crude petroleum imports rose 24.3% y/y but the quantity fell 1.5%.
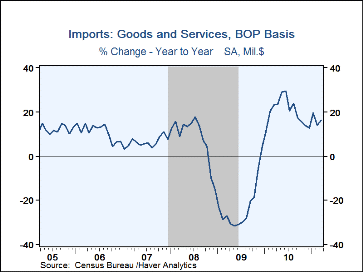
Overall imports rose 4.9% (16.4% y/y). Goods imports rose 5.8% (18.7% y/y) but when adjusted for higher prices, imports rose 3.7% (10.1% y/y). Nominal imports of foods, feeds & beverages ticked up 0.4% (15.8% y/y) though when adjusted for higher prices imports fell 2.3%. Nonauto capital goods imports rose 3.9% (19.7% y/y) and reversed most on the February decline. Virtually all of the y/y gain reflected higher volumes. Nonauto consumer goods imports fell 4.5% (+7.8% y/y) and all of the annual increase was real. Auto imports rose 11.0% (22.5% y/y). Again, these changes mostly reflect volumes, not prices.
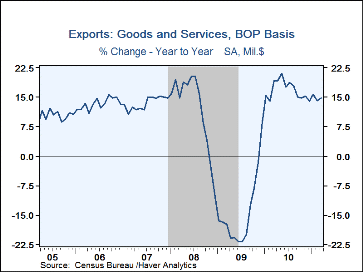
Total exports rose 4.6% (14.9% y/y) after a 1.5% February decline. A 6.2% increase (18.2% y/y) in goods exports reflected a 16.0% increase (26.5% y/y) in autos & parts, which was all real and a 6.0% increase (28.0% y/y) in foods, feeds & beverages, although this y/y gain was virtually all prices. Imports of nonauto consumer goods rose 5.3% in March (5.2% y/y), all real, and capital goods exports rose 2.6% (11.1% y/y), again all real.
Services exports increased 1.1% (6.1% y/y) reflecting gains in travel and passenger fares. Imports of services rose 0.8% (4.9% y/y) reflecting lesser changes in travel and passenger fares, held back by the lower dollar.
By country, the goods trade deficit with China held roughly stable m/m at $18.1B as exports rose 28.6% y/y and imports rose 13.6% y/y. (Imports are roughly four times the level of U.S. exports.) The trade deficit with Japan deteriorated to $6.1B, it deepest since 2008, as exports rose 13.3% y/y and imports rose 13.7% y/y. (Imports from Japan are roughly twice the level of U.S. exports.) The trade deficit with the European Union deteriorated sharply to $9.0B as U.S. exports rose 16.4% y/y and imports grew 19.0% y/y. (Imports from Europe are roughly one-third larger than U.S. exports.)
The international trade data can be found in Haver's USECON database. Detailed figures are available in the USINT database. The expectations figure is in the AS1REPNA database.
Understanding The Great Trade Collapse of 2008-09 and the Subsequent Trade Recovery from the Federal Reserve Bank of Chicago is available here.
| Foreign Trade | Mar | Feb | Jan | Y/Y | 2010 | 2009 | 2008 |
|---|---|---|---|---|---|---|---|
| U.S. Trade Deficit | $48.2B | $45.4B | $47.0B | $39.5B (3/10) |
$495.7B | $374.9B | $698.8B |
| Exports-Goods & Services (M/M) | 4.6 | -1.5% | 2.6% | 14.9% | 16.8% | -14.6% | 11.5% |
| Imports-Goods & Services | 4.9 | -1.9 | 5.4 | 16.4 | 19.7 | -23.3 | 8.0 |
| Petroleum | 18.0 | -5.4 | 10.3 | 30.1 | 32.5 | -44.0 | 37.0 |
| Nonpetroleum | 2.9 | -1.4 | 5.3 | 15.9 | 20.7 | -20.9 | 1.5 |
Tom Moeller
AuthorMore in Author Profile »Prior to joining Haver Analytics in 2000, Mr. Moeller worked as the Economist at Chancellor Capital Management from 1985 to 1999. There, he developed comprehensive economic forecasts and interpreted economic data for equity and fixed income portfolio managers. Also at Chancellor, Mr. Moeller worked as an equity analyst and was responsible for researching and rating companies in the economically sensitive automobile and housing industries for investment in Chancellor’s equity portfolio. Prior to joining Chancellor, Mr. Moeller was an Economist at Citibank from 1979 to 1984. He also analyzed pricing behavior in the metals industry for the Council on Wage and Price Stability in Washington, D.C. In 1999, Mr. Moeller received the award for most accurate forecast from the Forecasters' Club of New York. From 1990 to 1992 he was President of the New York Association for Business Economists. Mr. Moeller earned an M.B.A. in Finance from Fordham University, where he graduated in 1987. He holds a Bachelor of Arts in Economics from George Washington University.
More Economy in Brief
 Global| Feb 05 2026
Charts of the Week: Balanced Policy, Resilient Data and AI Narratives
by:Andrew Cates


