 Global| Nov 13 2009
U.S. Trade Deficit Increases DueTo Higher Oil Costs, Improved Economy
by:Tom Moeller
|in:Economy in Brief
Summary
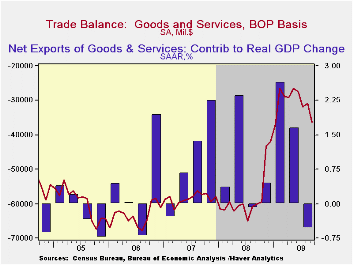
Following months of shrinkage due to lower oil prices and a poor economy, the September U.S. trade deficit widened significantly. The deficit of $36.5B followed a little-revised August figure of $30.8B and the m/m deterioration [...]
 Following
months of shrinkage due to lower oil prices and a poor economy, the
September U.S. trade deficit widened significantly. The deficit of
$36.5B followed a little-revised August figure of $30.8B and the m/m
deterioration greatly exceeded Consensus expectations for a deficit of
$31.6B. The latest figure was the deepest trade shortfall
since January. The rise in oil prices is evident in the trade deficit
figures adjusted for inflation. The m/m deterioration in the real
deficit was just under half that for nominal. However, offsetting that
was the improved economy which also lifted the inflation-adjusted
deficit as real imports jumped 6.2% m/m and by 10.1% over the last
three months.
Following
months of shrinkage due to lower oil prices and a poor economy, the
September U.S. trade deficit widened significantly. The deficit of
$36.5B followed a little-revised August figure of $30.8B and the m/m
deterioration greatly exceeded Consensus expectations for a deficit of
$31.6B. The latest figure was the deepest trade shortfall
since January. The rise in oil prices is evident in the trade deficit
figures adjusted for inflation. The m/m deterioration in the real
deficit was just under half that for nominal. However, offsetting that
was the improved economy which also lifted the inflation-adjusted
deficit as real imports jumped 6.2% m/m and by 10.1% over the last
three months.
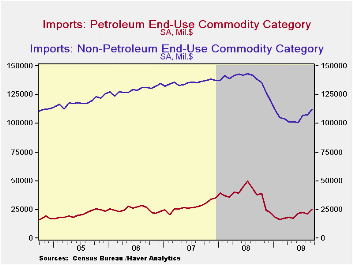
 During
September, petroleum imports jumped 20.9% after
having risen by over one-half since February. Higher prices prompted
that increase as crude oil costs rose to a September average of $68.17
per barrel versus the February low of $39.22. Since then crude oil has
risen even further to roughly $75 per barrel. The firmer economy raised
real imports of petroleum products by 6.9% during September and by 7.7%
over the last twelve months. That rise compares to declines of between
one and four percent during each of the last three years.
During
September, petroleum imports jumped 20.9% after
having risen by over one-half since February. Higher prices prompted
that increase as crude oil costs rose to a September average of $68.17
per barrel versus the February low of $39.22. Since then crude oil has
risen even further to roughly $75 per barrel. The firmer economy raised
real imports of petroleum products by 6.9% during September and by 7.7%
over the last twelve months. That rise compares to declines of between
one and four percent during each of the last three years.
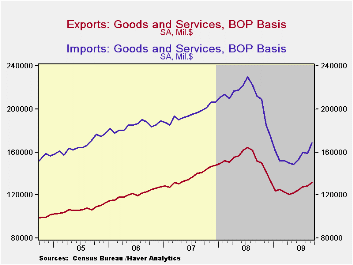
Economic recovery also was apparent in real nonoil imports which rose 4.2% during September and 11.3% during the last three months. These gains lessened the y/y decline to 14.8% from its worst of 24.6%. Real non-auto capital goods imports rose 2.5% (-18.9% y/y) and by 6.7% during the last three months. Real nonauto consumer goods rose 1.9% and 5.5% since June. Both of these increases are turnarounds from sharp declines through June. Real automotive vehicles & parts imports also turned higher by 11.4% (-12.1% y/y) in September and by nearly one-half since June. Despite the lower value of the dollar, economic recovery is further suggested by better travel figures. Imports of services have recently risen, with travel imports strong during three of the last four months as more U.S. residents went abroad.
 Reflecting
the competitive value of the dollar, real
merchandise exports during September rose 4.4% (-9.5% y/y) following
three months of 7.0% increase. That's a turnaround from 20% rates of
decline this summer. The chained dollar value of real capital goods
exports led the September increase with a 5.2% gain (-14.3% y/y) which
reversed an August drop. Non-auto consumer goods exports also rose 3.6%
and the y/y decline eased to 5.6% from the peak of -15.7%. Auto exports
were strong for the fourth straight month and the y/y decline of 26.2%
was half its worst reading. Exports of services also have been strong
of late.
Reflecting
the competitive value of the dollar, real
merchandise exports during September rose 4.4% (-9.5% y/y) following
three months of 7.0% increase. That's a turnaround from 20% rates of
decline this summer. The chained dollar value of real capital goods
exports led the September increase with a 5.2% gain (-14.3% y/y) which
reversed an August drop. Non-auto consumer goods exports also rose 3.6%
and the y/y decline eased to 5.6% from the peak of -15.7%. Auto exports
were strong for the fourth straight month and the y/y decline of 26.2%
was half its worst reading. Exports of services also have been strong
of late.
The international trade data can be found in Haver's USECON database. Detailed figures are available in the USINT database.
Trade, Globalization and the Financial Crisis from the Federal Reserve Bank of Dallas is available here.
| Foreign Trade | September | August | July | Y/Y | 2008 | 2007 | 2006 |
|---|---|---|---|---|---|---|---|
| U.S. Trade Deficit | $-36.5 | $30.8B | $31.9B | $60.1B (9/08) | $695.9 | $701.4 | $760.4 |
| Exports - Goods & Services | 2.9 | 0.2% | 2.5% | -13.2% | 11.2% | 13.2% | 13.3% |
| Imports - Goods & Services | 5.8 | -0.4% | 4.9% | -20.6% | 7.6 | 6.0% | 10.8% |
| Petroleum | 20.9 | -5.4% | 3.3% | -31.9% | 37.0% | 9.4% | 20.1% |
| Nonpetroleum Goods | 4.4 | 0.3% | 6.4% | -19.2% | 1.5% | 4.8% | 9.1% |
Michigan Consumer Sentiment Sags Once Again
by Carol Stone November 13, 2009
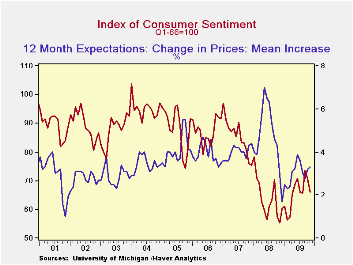 Consumer
sentiment declined again in early November, falling from October's 70.6
to 66.0, measured by the Reuters/University of Michigan Index of
Consumer Sentiment. Forecasters had looked for only a
marginal decrease to 70.0.
Consumer
sentiment declined again in early November, falling from October's 70.6
to 66.0, measured by the Reuters/University of Michigan Index of
Consumer Sentiment. Forecasters had looked for only a
marginal decrease to 70.0.
The reading on expectations for mid-November was down 4.9 points to 63.7 from October's 68.6. The primary weakness came in survey participants' outlook for business conditions over the next year. That had leaped to 88 in September and then fell back in October to 81 and now to 67. This move seems to show that the nice rise in September was a temporary blip, reversed last month and again now. Indeed, November's expectations for "times" to be "good" fell by 7 points and those for "times" to be "bad" increased by 7 points from October's amounts. Expected personal finances were also less optimistic, decreasing by 6 points in this survey round after a 2-point uptick last month. The latest move was related to a rise in the number of people who expect their income to fall during the coming year.
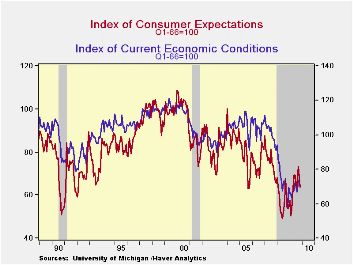 The
reading of current economic conditions also fell; it went
down 4.1 points from October to mid-November. People's
assessments of their current financial condition and business
conditions in general both moved adversely. In particular,
more respondents indicated that current "bad times" make this a "bad
time" to buy large consumer items. At 21, this reading was up
3 points in the month and returned to its level back at the beginning
of this year. The record high for this negative indicator is
24, reached in August 2008. Prior to this cycle, the record was 17 in
October 1992.
The
reading of current economic conditions also fell; it went
down 4.1 points from October to mid-November. People's
assessments of their current financial condition and business
conditions in general both moved adversely. In particular,
more respondents indicated that current "bad times" make this a "bad
time" to buy large consumer items. At 21, this reading was up
3 points in the month and returned to its level back at the beginning
of this year. The record high for this negative indicator is
24, reached in August 2008. Prior to this cycle, the record was 17 in
October 1992.
Expected price inflation during the next year amounted to 3.3% in this mid-November survey, according to the mean of participants' estimates, edging up from October's 3.2%. In contrast, the median of those estimates ticked down from 2.9% to 2.8%, suggesting that people see little overall change in price pressures this month.
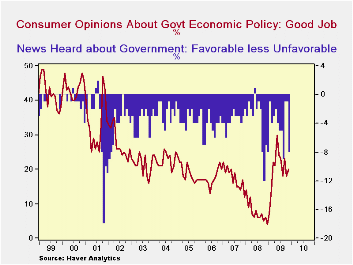 Respondents'
views on government
policy, which may eventually influence economic expectations, showed
mixed developments in this current survey. The number
expressing a favorable opinion rose from 86% in October to 88%,
reflected in a like increase in the number believing government is
doing "a good job" in November. At the same time, the
open-ended query about news reports people have heard gave a negative
spin to their impressions of government; the number hearing favorable
news about government fell from 6% last month to 3% and the number
hearing unfavorable news increased from 7% to 11%. While this
latter "news" reading has hardly ever been positive on a net basis, the
current -8 is well above averages between -3.5 and -4. So
people are clearly uneasy about the news they're getting on government
even though they're feeling marginally better about how government is
working in the economy.
Respondents'
views on government
policy, which may eventually influence economic expectations, showed
mixed developments in this current survey. The number
expressing a favorable opinion rose from 86% in October to 88%,
reflected in a like increase in the number believing government is
doing "a good job" in November. At the same time, the
open-ended query about news reports people have heard gave a negative
spin to their impressions of government; the number hearing favorable
news about government fell from 6% last month to 3% and the number
hearing unfavorable news increased from 7% to 11%. While this
latter "news" reading has hardly ever been positive on a net basis, the
current -8 is well above averages between -3.5 and -4. So
people are clearly uneasy about the news they're getting on government
even though they're feeling marginally better about how government is
working in the economy.
The Reuters/University of Michigan survey data are not seasonally adjusted. The reading is based on telephone interviews with about 500 households at month-end. These mid-month results are based on about 320 interviews. The summary indexes are in Haver's USECON database with details in the proprietary UMSCA database.p
| University of Michigan | Mid-November | October | September | Oct y/y | 2008 | 2007 | 2006 |
|---|---|---|---|---|---|---|---|
| Consumer Sentiment | 66.0 | 70.6 | 73.5 | 18.2% | 63.8 | 85.6 | 87.3 |
| Current Conditions | 69.6 | 73.7 | 73.4 | 21.0 | 73.7 | 101.2 | 105.1 |
| Expectations | 63.7 | 68.6 | 73.5 | 20.4 | 57.3 | 75.6 | 75.9 |
European GDP Turns Higher-But Disappoints
by Robert Brusca November 13, 2009
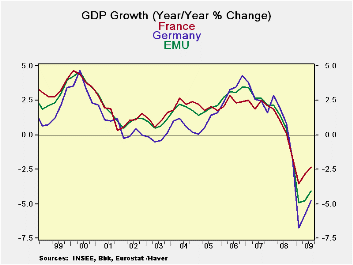
European GDP turned higher in Q3 but the results were
generally less than expected. Among the early ‘flash’ GDP reporters
France posted a small rise but it was the second rise in a row for
France. Greece with always volatile results posted the strongest rise
followed by Austria. Italy and The Netherlands have the largest Yr/Yr
declines in this group; the EMU Yr/Yr drop is of 4.1%. Greece is lower
Yr/Yr by just 1.6% Austria but just 2.2%. Germany the largest e-Area
economy is off by 4.8% Yr/Yr even though it has two quarters in a row
of solid growth under its belt.
Flash reports do not provide any GDP detail but the various
authorities do offer some account of their results. Both Germany and
France cited the role of exports in pushing growth ahead. In Germany
investment demand was also described as a key factor.
Paragon of strength or parasite of growth?
-- An unfolding theme in the Area is that exports, external demand, is
driving the European recovery. In France domestic demand was flat in
the quarter despite a ton of ongoing stimulus that has left France
unable to get its fiscal budget gap in line as soon as the EU
Commission wants it to. Hungary, in its GDP release today, complained
that exports were weak and that was sapping GDP strength. The largest
industrial economies would seem to be good candidates to spur world
growth with their own domestic demand instead of relying on the demand
increases elsewhere. Chancellor Merkel has defended Germanys ‘right’ to
be a leading exporters, Japan always seeks a surplus to ‘defend’
against the country’s lack of oil and dependence on oil and other
natural resource imports. China’s trade surplus grew larger last month.
How can ‘everyone’ have export led growth? How can the US (whose
current account deficit surged in November) get its deficit in line if
major competitor countries insist on running trade surpluses, spurring
exports and maintaining weak domestic demand at home? This is something
the G-20 has been completely unable to sort out.
These sorts of structural imbalances helped to lead to the
last financial crisis. Such flows underpinned the 1973-78 oil boom-bust
cycle. Factors that put persistent surpluses sand deficits in play are
dangerous and the G-20 has not plan to sort it out. At the weaker
dollar works to mitigate the US imbalance problem even if it is playing
with fire.
| European Growth for Selected Flash GDP Results | ||||||
|---|---|---|---|---|---|---|
| Q/Q Saar | Yr/Yr | |||||
| Q3-09 | Q2-09 | Q1-09 | Q3-09 | Q2-09 | Q1-09 | |
| Austria | 14.0% | -3.7% | -13.8% | -2.2% | -5.4% | -4.8% |
| France | 1.1% | 1.1% | -5.5% | -2.4% | -2.9% | -3.5% |
| Germany | 2.9% | 1.8% | -13.4% | -4.8% | -5.8% | -6.7% |
| Greece | 17.6% | 32.7% | -29.8% | -1.6% | -1.2% | -0.5% |
| Italy | 2.4% | -1.9% | -10.5% | -4.6% | -5.9% | -6.0% |
| Netherlands | 1.7% | -4.0% | -9.4% | -4.0% | -5.1% | -4.2% |
| EMU | 1.5% | -0.7% | -9.6% | -4.1% | -4.8% | -4.9% |
U.S. Import Prices Rise, Both Oil & Nonoil
by Tom Moeller November 13, 2009
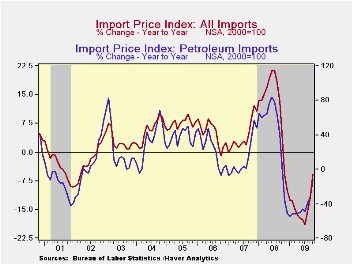
The U.S. economy is strengthening, so suggests price pressures
in the foreign trade accounts. Overall import prices rose 0.7%, though
the gain fell short of Consensus expectations for a 1.0% increase. The
rise was led by a 0.9% increase in petroleum prices which reversed a
like decline in September and promises to be followed by another strong
gain this month. The report indicated that non-oil import prices rose
0.7%, which was the strongest monthly increase since June of last year.
Moreover, on a three-month basis, these prices have risen at a 5.7%
annual rate after declining at a 13.6% rate as of last December.
(During the last ten years, there has been a negative 81% correlation
between the nominal trade-weighted exchange value of the US dollar vs.
major currencies and the y/y change in non-oil import prices.)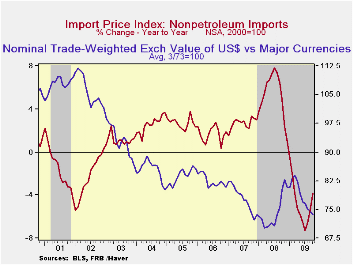
Import prices break down as follows: Chemical import prices
were quite strong and posted a 2.9% increase but they still were down
16.1% from last year. Iron & steel prices also were strong, up
2.4% m/m, but down by one-third from a year ago. Food prices increased
0.1% and at an 8.0% rate during the last three months. Capital goods
prices similarly posted a modest gain after five months of no change.
Prices for nonauto consumer goods rose 0.3% lifting the three-month
gain to 1.2% versus its weakest reading of -2.6% in January. Durable
consumer goods prices rose 0.4% (-0.9% y/y) but prices of household
goods slipped (-1.9% y/y) and furniture prices fell as well (-1.2%
y/y). Apparel prices were unchanged for the third month (-0.5% y/y).
Petroleum prices reversed their prior month's decline with a 0.9%
increase during October. This month crude oil prices have found further
strength with a rise to $76.94 yesterday from the October average of
$75.82 per barrel.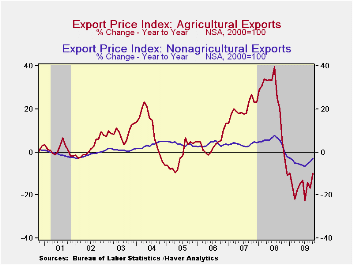
Total export prices resumed increasing modestly. The 0.3% rise was led by a 0.3% gain in nonagricultural export prices, down 2.7% y/y. Agricultural export prices actually fell 1.0% (-10.0% y/y).
The import and export price series can be found in Haver's USECON database. Detailed figures are available in the USINT database.
| Import/Export Prices (NSA, %) | October | September | August | Y/Y | 2008 | 2007 | 2006 |
|---|---|---|---|---|---|---|---|
| Import - All Commodities | 0.7 | 0.2 | 1.6 | -5.7 | 11.5 | 4.2 | 4.9 |
| Petroleum | 0.9 | -0.9 | 7.7 | -12.2 | 37.7 | 11.6 | 20.6 |
| Nonpetroleum | 0.7 | 0.4 | 0.3 | -3.8 | 5.3 | 2.7 | 1.7 |
| Export - All Commodities | 0.3 | -0.2 | 0.6 | -3.4 | 6.0 | 4.9 | 3.6 |

Tom Moeller
AuthorMore in Author Profile »Prior to joining Haver Analytics in 2000, Mr. Moeller worked as the Economist at Chancellor Capital Management from 1985 to 1999. There, he developed comprehensive economic forecasts and interpreted economic data for equity and fixed income portfolio managers. Also at Chancellor, Mr. Moeller worked as an equity analyst and was responsible for researching and rating companies in the economically sensitive automobile and housing industries for investment in Chancellor’s equity portfolio. Prior to joining Chancellor, Mr. Moeller was an Economist at Citibank from 1979 to 1984. He also analyzed pricing behavior in the metals industry for the Council on Wage and Price Stability in Washington, D.C. In 1999, Mr. Moeller received the award for most accurate forecast from the Forecasters' Club of New York. From 1990 to 1992 he was President of the New York Association for Business Economists. Mr. Moeller earned an M.B.A. in Finance from Fordham University, where he graduated in 1987. He holds a Bachelor of Arts in Economics from George Washington University.
More Economy in Brief


