 Global| Jun 10 2009
U.S. Trade Deficit Edged HigherAs Revision Impact On Data Is Minor
Summary
The ‘what’ of trade in April: The U.S. trade deficit widened modestly in April as exports declined and imports moved lower despite a bump up from oil imports. The U.S. deficit in international trade of goods and services increased to [...]
The ‘what’ of trade in April: The U.S. trade deficit widened
modestly in April as exports declined and imports moved lower despite a
bump up from oil imports. The U.S. deficit in international trade of
goods and services increased to $29.16 billion from a revised $28.53
billion in March. The March trade gap was originally reported as $27.58
billion. There is not much in the report that is significantly
different from market expectations this month. But the shifting in
trends is important.
Perspective: The June deficit was in line with Wall Street
expectations for a $29 billion shortfall. U.S. exports in April fell
2.3% to $121.11 billion: that is the lowest level since July 2006.
Imports decreased to their lowest level since September 2004, as they
fell 1.4% to $150.28 billion.
The Oil factor: The U.S. bill for crude oil imports in April
rose to $13.63 billion from $11.98 billion the month before as oil
prices rebounded. The average price per barrel climbed to $46.60 from
$41.36 the previous month. Crude import volumes rose to 292.60 million
barrels from 289.69 million further boosting the oil import total.
Trade, an unintended engine of growth: Trade has been one of
the most powerful buffering factors to declining US GDP. It is one of
the so-called automatic stabilizers. Imports are linked to GDP through
a high import responsive relationship (called an ‘elasticity’) that
implies that imports fall nearly twice as fast as GDP when it drops.
Since imports subtract from GDP a decline in imports boosts GDP.
Through this channel trade has buffered the GDP decline. Some of that
buffering was eaten up by exports which respond, but with less
sensitivity, to foreign GDP growth as foreign GDP and exports have
dropped too.
Trade arithmetic meets economic impact - a paradox: Trade is a
complicating factor in understanding GDP since when imports drop they
boost GDP but - at the same time - weak imports imply a weak underlying
GDP. Basically dropping imports are not a good sign for US growth even
though they will boost it. Since so many consumer goods are imported,
falling imports also are often associated with weak inventories and
when inventories drop GDP is made weaker. These relationships play out
in the GDP accounts and you can see them playing out in this cycle.
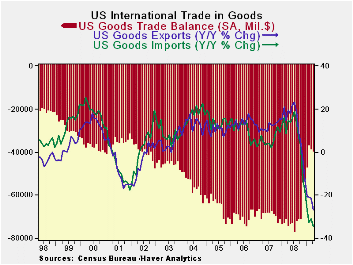
When we cut through the arithmetic of the trade account and its myriad
relationships the economic import is clear. The deficit stabilized
around $60 billion per month in the second and third quarter of last
year. By December the monthly red ink had declined to -$41.6 bil and by
Feb it reached its deficit low point at -$26.08 bil. Over the past two
months it is edging higher. That is bad news for the deficit but good
news for growth. US exports are stirring (in the sense of falling more
slowly), but imports are diminishing their rate of decline faster hence
the deficit expands. Some of that is oil. Rising oil prices remind us
of the inflation risk as the world economy reflates. The bottom line is
that trade arithmetic is often at odds with GDP fundamentals. The
incipient rise in the US deficit is good news. At some point the US
will have to find a way to blunt its appetite for imports. Putting
domestic automakers out of business is not the way to do that. The
survival and beefing up of US industry, changing consumer habits, and
finding an energy work-around will be part of the solution. And it will
be a slow process.
| US Merchandise And Services Trade | |||||
|---|---|---|---|---|---|
| Category | Current | Previous | $SA % SAAR/Average | ||
| % M/M: Current & Previous | |||||
| Apr.09 | M: $blns/% | M: $blns/% | 3-MO | 6-MO | Yr/Yr |
| Gds&Services Balance | -$29.16 | -$28.53 | -$27.92 | -$34.24 | -$47.62 |
| Goods Balance | -$40.09 | -$39.22 | -$38.84 | -$45.26 | -$59.25 |
| Exports (G&S) | -2.3% | -2.0% | -11.7% | -34.6% | -21.8% |
| Merchandise | -3.1% | -2.1% | -11.4% | -40.7% | -26.6% |
| Services | -0.5% | -1.7% | -12.3% | -19.6% | -10.3% |
| Imports (G&S) | -1.4% | 0.0% | -25.1% | -48.3% | -30.7% |
| Merchandise | -1.4% | 0.2% | -27.3% | -53.0% | -34.6% |
| Nonpetroleum Products | -2.0% | -1.2% | -30.5% | -43.9% | -28.3% |
| Petroleum & Product | 2.1% | 8.7% | -6.3% | -78.3% | -54.9% |
| Services | -1.5% | -0.9% | -15.3% | -20.5% | -9.7% |
| Technology Trade | |||||
| Tech Exports | -9.9% | 9.5% | -1.0% | -29.4% | -18.3% |
| Tech Imports | 0.1% | 14.7% | 63.5% | -38.1% | -18.3% |
| Crude Oil | |||||
| MBD (Volume):Mb/d | 9.75 | 9.35 | 9.40 | 9.49 | 9.68 |
| $/BBL | $46.60 | $41.36 | $42.39 | $47.27 | $79.25 |
| Non Petroleum trade | |||||
| Exports | -3.5% | -2.0% | -10.0% | -39.5% | -25.9% |
| Imports | -2.0% | -1.2% | -30.5% | -43.9% | -28.3% |
| Balance | -$23.93 | -$23.19 | -$23.32 | -$27.86 | -$31.75 |
| Real Exports and Imports: Non-Petroleum trade | |||||
| Real Nonoil Exports | -3.9% | 8.1% | 30.5% | -34.0% | -21.7% |
| Real Nonoil Imports | -1.7% | 2.6% | -15.4% | -38.5% | -24.8% |
| Balances are In Blns averages for period: Others % annualized except monthly | |||||
by Robert BruscaJune 10, 2009
In April three of five large EU countries experienced monthly
increases in industrial production. We can set Spain aside, to some
extent, since its monthly figures are so volatile. Still, Spain and the
UK are the only two of this group to have IP also up over three months.
Only Spain shows IP’s negative growth rates as steadily decelerating
from 12 months to six months to three months, and finally turning
positive. The UK’s positive numbers over three months come without the
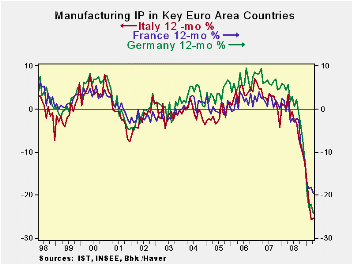
persistence of deceleration. All countries in this group except Italy
show that the IP drop is decelerating (or that it is rising) over
three-months compared to six months. And although for Italy the
calculation is a close one, over three months Italy’s IP is falling at
a faster rate than it is falling over 12-mnths; it is the only country
like that.
On balance there is power in numbers and a number of countries
did report an IP bounce in April. That makes the bounce look like a
real phenomenon, not just something aberrant. Most show various
evidence that the IP deceleration is slowing in the recent
three-months. Italy is the exception. Despite posting a rise in IP in
April its trends still are not reassuring. Spain, despite the extreme
volatility in its index shows the most persisting deceleration in the
group. The trick for Spain will be to see if that trend stays in place
next month. The challenge for Italy is to join the progress in the rest
of the group.
| Main E-Area Countries and UK IP in MFG | |||||||
|---|---|---|---|---|---|---|---|
| Mo/Mo | 3-Mo | 6-mo | 12-mo | Apr-09 | |||
| MFG Only | Apr-09 | Mar-09 | Feb-09 | Apr-09 | Apr-09 | Apr-09 | Q:2-Date |
| Germany: | -2.9% | 0.8% | -3.5% | -20.5% | -36.8% | -24.2% | -19.4% |
| France:IPxConstruct'n | -1.4% | -1.7% | -0.9% | -15.0% | -22.5% | -18.8% | -15.8% |
| Italy | 0.7% | -4.7% | -5.0% | -30.9% | -30.6% | -25.2% | -22.7% |
| Spain | 5.8% | -5.0% | 1.2% | 7.1% | -24.7% | -28.6% | 16.7% |
| UK | 0.2% | 0.2% | -0.2% | 0.9% | -15.2% | -12.7% | 1.8% |
| Mo/Mo are simple percent changes others are at saars | |||||||

Robert Brusca
AuthorMore in Author Profile »Robert A. Brusca is Chief Economist of Fact and Opinion Economics, a consulting firm he founded in Manhattan. He has been an economist on Wall Street for over 25 years. He has visited central banking and large institutional clients in over 30 countries in his career as an economist. Mr. Brusca was a Divisional Research Chief at the Federal Reserve Bank of NY (Chief of the International Financial markets Division), a Fed Watcher at Irving Trust and Chief Economist at Nikko Securities International. He is widely quoted and appears in various media. Mr. Brusca holds an MA and Ph.D. in economics from Michigan State University and a BA in Economics from the University of Michigan. His research pursues his strong interests in non aligned policy economics as well as international economics. FAO Economics’ research targets investors to assist them in making better investment decisions in stocks, bonds and in a variety of international assets. The company does not manage money and has no conflicts in giving economic advice.
More Economy in Brief


