 Global| Apr 12 2006
U.S. Trade Deficit Down
by:Tom Moeller
|in:Economy in Brief
Summary
During February, the U.S. foreign trade deficit reversed most of the prior month's unrevised surge and fell to $65.7B. The decline exceeded Consensus expectations for a deficit of $67.5B. A 2.3% decline in imports during February was [...]
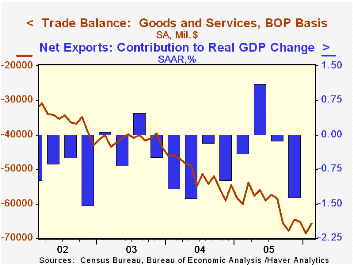
During February, the U.S. foreign trade deficit reversed most of the prior month's unrevised surge and fell to $65.7B. The decline exceeded Consensus expectations for a deficit of $67.5B.
A 2.3% decline in imports during February was led by a 3.6% fall (+7.3% y/y) in nonpetroleum imports which reversed the prior month's jump. Imports of capital goods fell 4.4% (+9.1% y/y) due to a huge 23.7% drop in civilian aircraft (+10.1% y/y). Imports of advanced technology products fell 8.5% (NSA, +8.4% y/y).Nonauto consumer goods also reversed the prior month's gain with a 2.5% decline (-0.4% y/y) due to lower imports of furniture & appliances.
Petroleum imports rose 0.2% (38.8% y/y) but in constant dollars they were 0.6% (-2.6% y/y) lower. The quantity of crude oil imports fell 3.9% (-2.0% y/y) and all energy-related petroleum product imports fell 8.9% (-2.9% y/y). Crude oil prices rose 3.4% (45.8% y/y) to an average $53.72 per bbl.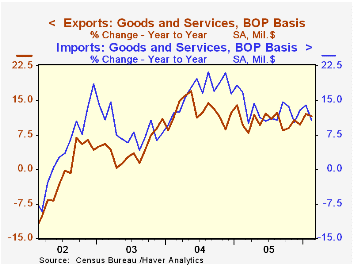
Total exports gave back roughly half of the prior month's strong gain with a 1.2% drop led by a by a 0.8% decline in exports of nonauto consumer goods (+9.5% y/y) which was the second consecutive m/m drop. Capital goods exports also fell by 0.8% (+17.6% y/y) though that followed a 2.9% January jump while exports of advanced technology products rose 0.7% (NSA, +24.0% y/y).
The US trade deficit with China narrowed sharply to $13.9B ($201.6B for 2005) as exports jumped (32.6% y/y). The trade deficit with Japan deepened to $7.1B ($82.7B in 2005) as exports rose 10.1% y/y. The trade deficit with the Asian NICs halved versus January to $1.1B ($15.9B in 2005) and a 4.7% y/y rise in exports outpaced the 3.5% increase in imports. The deficit with the European Union narrowed for the fourth consecutive month and stood at $8.3B ($122.4B in 2005).
External Imbalances and Adjustment in the Pacific Basin: Conference Summary from the Federal Reserve Bank of San Francisco can be found here.
| Foreign Trade | Feb | Jan | Y/Y | 2005 | 2004 | 2003 |
|---|---|---|---|---|---|---|
| Trade Deficit | $65.7B | $68.6B | $60.1B (2/05) | $723.6B | $617.6B | $494.8B |
| Exports - Goods & Services | -1.2% | 2.5% | 11.5% | 10.5% | 12.6% | 4.6% |
| Imports - Goods & Services | -2.3% | 3.6% | 10.7% | 12.8% | 16.6% | 8.5% |
by Tom Moeller April 12, 2006
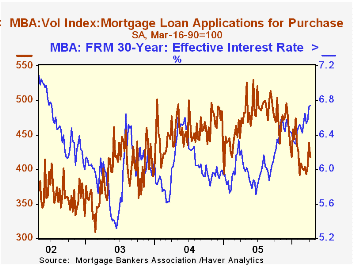
The 5.5% decline last week in the total number of mortgage applications reversed most of the increases during the prior two periods. The decline left applications at the start of April about equal to the March average which fell 1.0% from February.
Purchase applications fell 4.7% w/w but began the new month up 2.5% from the March average which rose 0.2% versus February.
During the last ten years there has been a 54% correlation between the y/y change in purchase applications and the change in new plus existing single family home sales.
Applications to refinance slid 6.6% w/w and began April 3.9% below the March average.
The effective interest rate on a conventional 30-year mortgage increased another two basis points w/w to 6.74% while the rate on 15-year financing rose to 6.46%. Interest rates on 15 and 30 year mortgages are closely correlated (>90%) with the rate on 10 year Treasury securities and during the last ten years there has been a (negative) 82% correlation between purchase applications and the effective rate on a 30-Year mortgage.
The Mortgage Bankers Association surveys between 20 to 35 of the top lenders in the U.S. housing industry to derive its refinance, purchase and market indexes. The weekly survey accounts for more than 40% of all applications processed each week by mortgage lenders. Visit the Mortgage Bankers Association site here.
| MBA Mortgage Applications (3/16/90=100) | 04/07/06 | 03/31/06 | Y/Y | 2005 | 2004 | 2003 |
|---|---|---|---|---|---|---|
| Total Market Index | 579.4 | 612.8 | -15.2% | 708.6 | 735.1 | 1,067.9 |
| Purchase | 417.7 | 438.2 | -12.0% | 470.9 | 454.5 | 395.1 |
| Refinancing | 1,532.4 | 1,640.8 | -19.3% | 2,092.3 | 2,366.8 | 4,981.8 |
by Carol Stone April 12, 2006
Industrial production reports from Italy and Netherlands give encouraging views of activity in those countries in February, hinting at least at stabilization or potentially an upturn. Industrial activity in India, meanwhile, dipped slightly in February after a strong gain in January, basically extending the protracted uptrend in that nation.
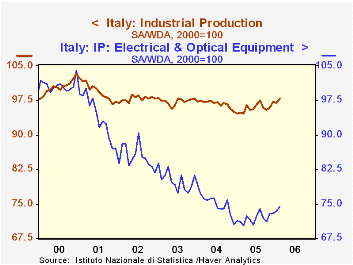
Production was up 0.8% in Italy, the third sizable rise in the last four months. The year-on-year gain was a quite respectable 3.3%. A variety of industries contributed: wood products, publishing, metals and metal products and machinery. Leather and footwear and electrical equipment extended flat patterns which have followed long-lasting declines (see the first graph). The seasonally adjusted index in February was 97.8 (2000=100), the highest since December 2003.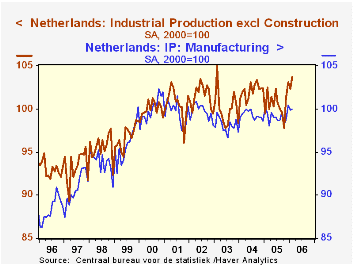
In the Netherlands, total production rose a notable 1.4% in the month, but that followed an 0.8% decrease in January. Food production, textiles and electrical equipment have all added to total output. But other industries have been sluggish, so the overall manufacturing sector, while tending higher, gives a less decisive picture. Mining and quarrying activity and utility output have been up sharply the last few months, causing the stronger performance of the total index.
India, in contrast, persists in expansion. A modest decrease in February of 0.14% followed a 2.36% jump the month before. The year-on-year advance is 8.8%. Leading industries include rubber, plastics and petroleum products, nonmetallic minerals, metals, machinery and "other".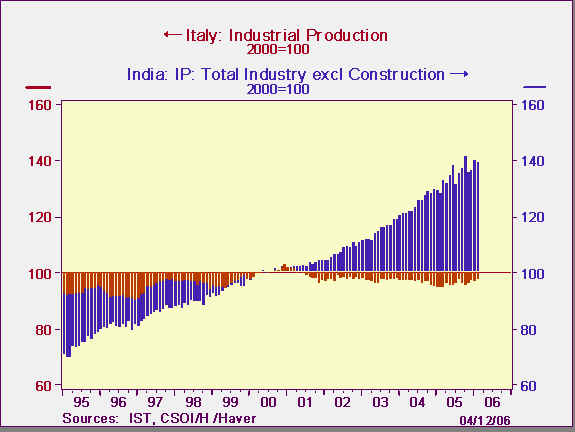
India reports its index on a base year of fiscal 1993=100, that is, April 1993-March 1994. We can quickly convert it to a calendar year 2000 base, facilitating comparison with Italy and the Netherlands. In Haver's software DLXVG3, one of the "Advanced Functions" is "Index": click "fn" or use the keystroke Alt-F; the box that opens includes a choice called "Index", allowing users to insert the year they want as a base. Thus, we can see quickly in the the third graph that while industrial production in Italy is actually below its 2000 amount, that in India has grown some 39.5%. Note that we drew the graph using the "horizontal reference" feature. This is listed in the "Graph" drop-down menu; we set it at 100. Then if we ask for the graph to be a bar-chart (by clicking on the "bars" up in the tool-bar, the software will center the graph's bars above and below our chosen reference line.
| Industrial Production | Feb 2006 | Jan 2006 | Dec 2005 | Feb 2005 | 2005 | 2004 | 2003 |
|---|---|---|---|---|---|---|---|
| Italy (2000=100) | 97.8 | 97.0 | 97.3 | 94.9 | 95.9 | 96.8 | 97.3 |
| Netherlands (2000=100) | 103.7 | 102.3 | 103.1 | 102.5 | 100.7 | 102.1 | 100.1 |
| India (FY93=100) | 224.9 | 225.2 | 220.0 | 206.6 | 216.6 | 200.8 | 185.2 |
| (Cal2000=100) | 139.5 | 139.6 | 136.4 | 128.1 | 134.3 | 124.5 | 114.8 |

Tom Moeller
AuthorMore in Author Profile »Prior to joining Haver Analytics in 2000, Mr. Moeller worked as the Economist at Chancellor Capital Management from 1985 to 1999. There, he developed comprehensive economic forecasts and interpreted economic data for equity and fixed income portfolio managers. Also at Chancellor, Mr. Moeller worked as an equity analyst and was responsible for researching and rating companies in the economically sensitive automobile and housing industries for investment in Chancellor’s equity portfolio. Prior to joining Chancellor, Mr. Moeller was an Economist at Citibank from 1979 to 1984. He also analyzed pricing behavior in the metals industry for the Council on Wage and Price Stability in Washington, D.C. In 1999, Mr. Moeller received the award for most accurate forecast from the Forecasters' Club of New York. From 1990 to 1992 he was President of the New York Association for Business Economists. Mr. Moeller earned an M.B.A. in Finance from Fordham University, where he graduated in 1987. He holds a Bachelor of Arts in Economics from George Washington University.


