 Global| Jan 11 2008
U.S. Trade Deficit Deepest Since Last August, Oil Imports Surged
by:Tom Moeller
|in:Economy in Brief
Summary
The U.S. foreign trade deficit deepened to $63.1B in November from an unrevised $57.8B during October. Consensus expectations had been for a deficit of $60.0B. During the first eleven months of 2007 the deficit averaged $59.1B versus [...]
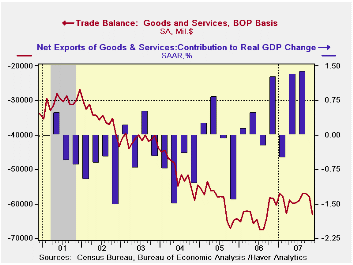
The U.S. foreign trade deficit deepened to $63.1B in November from an unrevised $57.8B during October. Consensus expectations had been for a deficit of $60.0B.
During the first eleven months of 2007 the deficit averaged $59.1B versus an average of $63.5B during the first eleven months of 2006.
U.S. exports rose 0.4% after an unrevised 0.9% gain during
October. During the first eleven months of last year exports rose 12.3%.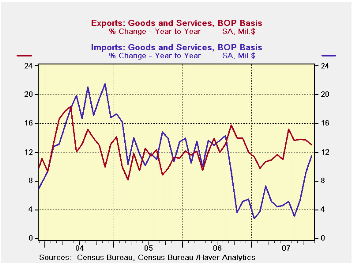
Exports of goods ticked up just 0.1% (13.7% y/y) after a 0.5% advance during October. The latest was the smallest rise since a slight decline last April. Exports of capital goods reversed much of an October surge with a 2.3% (+6.1% y/y) drop. Exports of civilian aircraft (-2.4% y/y) reversed nearly all of an 18.7% drop. Exports of computers surged 8.6% (22.3% y/y) but nonfood exports less autos fell 0.9% (+8.9% y/y).
U.S. exports of services rose another strong 1.3% (11.4 y/y).
Travel exports jumped again by 1.1% (21.2% y/y) and passenger fares
surged 2.1% (18.1% y/y).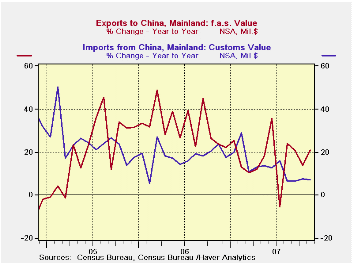
Overall imports surged 3.0% as higher oil prices raised petroleum imports by 16.3%. The quantity of energy related products fell 3.3% (+3.1% y/y) but the per barrel price of crude petroleum surged 9.9% (52.5% y/y). Imports of nonauto consumer goods surged 2.0% (4.1% y/y) after a strong 1.2% October gain but capital goods imports rose just 0.4% (5.9% y/y) after a 1.4% October decline.
Imports of services rose 0.4% (8.3% y/y) after a 1.0% October increase.
The U.S. trade deficit in goods with China improved slightly
m/m to $24.0B. During the first eleven months of 2007 the deficit with
China averaged $21.6B versus $19.4B in 2006. Exports to China rose
20.9% y/y and imports rose 7.2%.
Yesterday's speech titled Financial Markets, the Economic Outlook, and Monetary Policy by Federal Reserve Chairman Ben S. Bernanke can be found here.
| Foreign Trade | November | October | Y/Y | 2006 | 2005 | 2004 |
|---|---|---|---|---|---|---|
| U.S. Trade Deficit | $63.1B | $57.8B | $58.5B (11/06) |
$758.5 | $714.4B | $612.1B |
| Exports - Goods & Services | 0.4% | 0.9% | 13.0% | 12.7% | 10.9% | 13.7% |
| Imports - Goods & Services | 3.0% | 1.0% | 11.4% | 10.4% | 12.9% | 16.8% |
| Petroleum | 16.3% | 8.4% | 55.5% | 20.1% | 39.6% | 35.6% |
| Nonpetroleum Goods | 1.0% | -0.4% | 4.8% | 9.1% | 10.3% | 14.7% |
by Robert Brusca January 11, 2008
The OECD trend restores leading indicators show a slowing is
in progress across the OECD area. The OECD prefers to look at 6-month
changes in its indicators; these are presented for four separate
non-overlapping periods at the bottom of the table. All
regions/countries shown have declines over the recent past six months -
that indicates a loss of momentum. Over the previous 6-months only OECD
Europe was declining, although Japan barely avoided decline with a 0.1%
rise. Then over the previous two six month periods all regions saw
their trend restored leading indicators declining. What we have is a
slowdown that is broad-based.
It is very severe in some places. Japan’s six month drop of 7.5% is
sharp. The US drop of 3.8% is also considerable. The OECD Europe drop
of 2.4% is substantial.
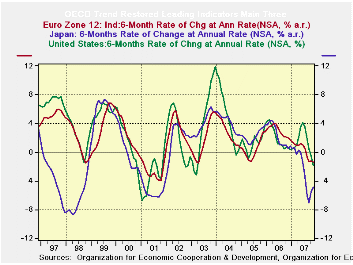
In the chart above we plot the various indices against the
recession bars for the US. The current US decline is not as severe as
it was the last time that the US went into recession. Japan’s decline
is on the same order of magnitude as it was the last time the US was in
recession, however. Europe’s decline is more like the sort of slowing
it had in 1996 than when the US was in recession in 2001. However, for
all these comparisons the situation is still in flux and in most places
flux means that conditions are still deteriorating.
| OECD Trend-restored leading Indicators | ||||
|---|---|---|---|---|
| Growth progression-SAAR | 3-Mos | 6-Mos | 12-mos | Yr-Ago |
| OECD | -3.1% | -3.1% | -0.3% | 2.2% |
| OECD 7 | -4.5% | -4.2% | -1.0% | 1.4% |
| OECD Europe | -1.8% | -2.4% | -0.7% | 2.4% |
| OECD Japan | -1.2% | -7.5% | -3.8% | 1.4% |
| OECD US | -6.6% | -3.8% | -0.1% | 1.5% |
| Six month readings at 6-Mo Intervals: | ||||
| Recent six | 6-Mo Ago | 12-Mo Ago | 18-Mo Ago | |
| OECD | -3.1% | 2.6% | 0.9% | 3.6% |
| OECD 7 | -4.2% | 2.2% | 0.1% | 2.6% |
| OECD Europe | -2.4% | 0.9% | 1.1% | 3.6% |
| OECD Japan | -7.5% | 0.1% | -0.5% | 3.3% |
| OECD US | -3.8% | 3.6% | 0.5% | 2.4% |
| Slowdowns indicated by BOLD RED | ||||
by Robert Brusca January 11, 2008
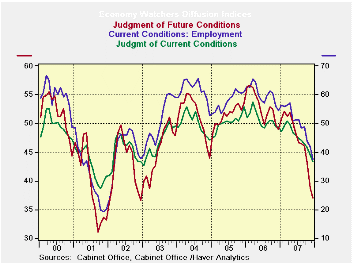
The Economy watcher indices and the Teikoku indices are all at
relative low points in their respective ranges. The headline economy
watchers index is in the bottom 5% of its five year range. Still
Japanese authorities say that the virtuous circle is intact (some
circle). The Economy Watchers’ employment index is at a five year low.
The future index from the Economy Watchers complex is in the bottom 1.5
percentile of its five year range. Surely this can’t be good.
We can add to this the finding in the November US trade report
that real non petroleum US exports growth has turned negative over
three months. Surely the rest of the world economy is slowing down and
slumping US exports – despite their competitiveness- is one sign. These
results from Japan are just another piece of the puzzle that helps to
explain US export weakness despite a huge decline in the dollar
exchange rate (although it’s not so weak vs the yen).
The Teikoku sector indices echo the Economy-Watcher findings.
The manufacturing, retail and wholesale sector indices are on five year
lows. Construction is in the bottom 16% of its range. Services are
‘relatively strong’ holding to the bottom 20% of their range…
Japan is still slowing and expectations of the Economy
Watchers do NOT see a turning here soon. Results still seem to be worse
than what the government wants to admit.
| Key Japanese surveys | |||||||
|---|---|---|---|---|---|---|---|
| Raw readings of each survey | Percent of 5Yr range* | ||||||
| Dec-07 | Nov-07 | Oct-07 | Sep-07 | Dec-07 | Nov-07 | Oct-07 | |
| Diffusion | |||||||
| Economy Watchers | 36.6 | 38.8 | 41.5 | 42.9 | 5.0% | 15.1% | 27.5% |
| Employment | 37.5 | 41.9 | 43.8 | 48.8 | 0.0% | 14.7% | 21.5% |
| Future | 37.0 | 38.8 | 43.1 | 46.0 | 1.5% | 10.6% | 32.2% |
| NTC Manufacturing | 52.3 | 50.8 | 49.5 | 49.8 | 47.3% | 30.2% | 15.5% |
| Econ Trends (Teikoku'/50 neutral/weighted diffusion) | |||||||
| Manufacturing | 40.8 | 41.7 | 42.4 | 43.8 | 0.0% | 9.7% | 18.9% |
| Retail | 34.2 | 34.4 | 37.2 | 37.7 | 0.0% | 0.0% | 17.1% |
| Wholesale | 37.0 | 38.3 | 39.1 | 40.2 | 0.0% | 0.0% | 6.3% |
| Services | 43.5 | 45.0 | 45.6 | 46.6 | 20.1% | 36.4% | 42.7% |
| Construction | 32.0 | 32.6 | 34.7 | 36.8 | 16.4% | 22.8% | 43.8% |
| 100 is high; Zero is low | |||||||
by Tom Moeller January 11, 2008
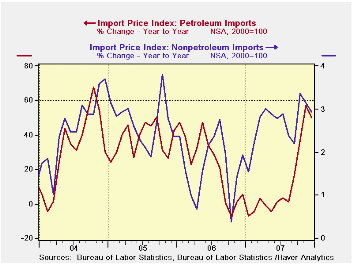
Overall import prices were unchanged, as expected, last month after the revised 3.3% spurt during November.
Petroleum prices, overall, eased 0.6% after the 12.7% November surge. Crude petroleum prices rose 0.6% (53.5% y/y) after a 12.0% November jump while fuel oil prices fell 5.5% (+43.5% y/y).
Less petroleum, import prices rose 0.3% after a 0.7% November gain.
During the last ten years there has been a 66% (negative) correlation between the nominal trade-weighted exchange value of the US dollar vs. major currencies and the y/y change in non oil import prices. The correlation is a reduced 47% against a broader basket of currencies for industrial supplies & materials excluding petroleum rose another 0.7% (6.9% y/y). The detailed import price series can be found in the Haver USINT database.
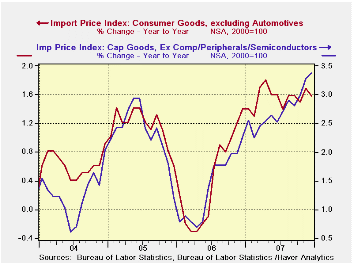
Capital goods import prices were unchanged (0.8% y/y). Prices of computers, peripheral and semiconductors fell 0.6% (-5.3% y/y) and less the high tech sector capital goods prices rose 0.3% (3.4% y/y).
Prices for imports of nonauto consumer goods rose 0.2% (1.6% y/y) as apparel prices rose 0.3% (1.9% y/y). These prices had been unchanged or declining through 2004 to 2006. Prices for household goods rose 0.1% (1.2% y/y) and that y/y growth has been fairly stable.
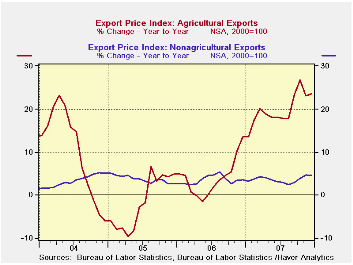
The gain in overall export prices eased to 0.4%, half the prior month's increase. Agricultural prices surged again, last month by 2.7% (23.5% y/y) which was double the November increase. Prices for nonagricultural price goods eased to a 0.3% (4.5% y/y) rise after a 0.9% surge during November.
Sovereign Wealth Funds: Stumbling Blocks or Stepping Stones to Financial Globalization? from the Federal Reserve Bank of San Francisco can be found here.
| Import/Export Prices (NSA) | December | November | Y/Y | 2007 | 2006 | 2005 |
|---|---|---|---|---|---|---|
| Import - All Commodities | 0.0% | 3.3% | 10.9% | 4.2% | 4.9% | 7.5% |
| Petroleum | -0.6% | 12.7% | 50.1% | 11.7% | 20.6% | 37.6% |
| Non-petroleum | 0.3% | 0.7% | 2.9% | 2.7% | 1.7% | 2.7% |
| Export- All Commodities | 0.4% | 0.9% | 6.0% | 4.9% | 3.6% | 3.2% |

Tom Moeller
AuthorMore in Author Profile »Prior to joining Haver Analytics in 2000, Mr. Moeller worked as the Economist at Chancellor Capital Management from 1985 to 1999. There, he developed comprehensive economic forecasts and interpreted economic data for equity and fixed income portfolio managers. Also at Chancellor, Mr. Moeller worked as an equity analyst and was responsible for researching and rating companies in the economically sensitive automobile and housing industries for investment in Chancellor’s equity portfolio. Prior to joining Chancellor, Mr. Moeller was an Economist at Citibank from 1979 to 1984. He also analyzed pricing behavior in the metals industry for the Council on Wage and Price Stability in Washington, D.C. In 1999, Mr. Moeller received the award for most accurate forecast from the Forecasters' Club of New York. From 1990 to 1992 he was President of the New York Association for Business Economists. Mr. Moeller earned an M.B.A. in Finance from Fordham University, where he graduated in 1987. He holds a Bachelor of Arts in Economics from George Washington University.
More Economy in Brief


