 Global| Nov 13 2003
U.S. Trade Deficit Deepened
by:Tom Moeller
|in:Economy in Brief
Summary
The U.S. foreign trade deficit deepened more than expected in September to $41.3B. Consensus expectations were for a deficit of $40.0B. The deficit in August was revised slightly deeper. Nonpetroleum imports rose 4.5% (4.1% y/y) and [...]
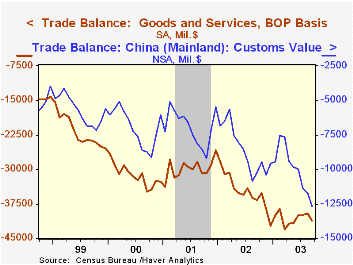
The U.S. foreign trade deficit deepened more than expected in September to $41.3B. Consensus expectations were for a deficit of $40.0B. The deficit in August was revised slightly deeper.
Nonpetroleum imports rose 4.5% (4.1% y/y) and petroleum imports rose 1.6% (14.6% y/y).
Automobile imports jumped 10.6% (-2.4% y/y) but that followed a 13.3% August decline. Capital goods imports also jumped 6.0% (7.1% y/y).
Exports surged 2.8% (8.4% YTD, AR) in September. Exports of capital goods jumped 3.2% (13.5% YTD, AR) and nonauto consumer goods exports recovered all of the prior two months' decline with a 3.7% gain (14.6% YTD, AR).
By country, the US trade deficit with China deepened to $12.7B in September and $119.6B (AR) year to date versus a deficit of $103.1B last year. With Japan the US trade deficit deepened to $5.1B and $64.1B (AR) year to date versus $70.0B last year. The US trade deficit with the European Union deepened to $8.1B and $90.6B (AR) year to date versus a deficit of $82.1B last year.
| Foreign Trade | Sept | Aug | Y/Y | 2002 | 2001 | 2000 |
|---|---|---|---|---|---|---|
| Trade Deficit | $41.3B | $39.5B | $36.7B(9/02) | $418.0B | $357.8B | $375.4B |
| Exports - Goods & Services | 2.8% | -2.6% | 4.7% | -3.3% | -5.8% | 10.8% |
| Imports - Goods & Services | 3.3% | -2.2% | 7.1% | 2.0% | -5.5% | 17.8% |
by Tom Moeller November 13, 2003
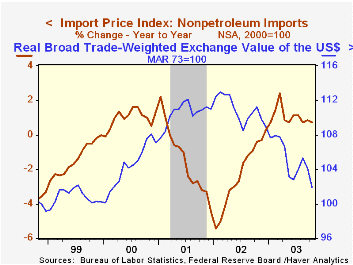
Prices for imported commodities rose in October by 0.1% (0.9% y/y). The rise was quite a bit weaker than Consensus expectations for a 0.4% increase.
Petroleum import prices rose 2.3% last month following a 5.0% decline in September. So far in November, the price of Brent Crude Oil is down slightly from the $29.81/bbl averaged in October.
Non-petroleum import prices fell 0.1% last month. The decline was not broad based but capital goods fell 0.5% (-1.1% y/y). Non-auto consumer goods prices dipped 0.1% (-0.3% y/y) and motor vehicle prices gained 0.6% (0.4% y/y).
Export prices rose 0.3% reflecting additional strength in food prices (9.3% y/y). Export prices elsewhere were tame.
For a report from the Federal Reserve Bank of New York titled "Exchange Rate Pass-Through into Import Prices: A Macro of Micro Phenomenon?", click here.
| Import/Export Prices (NSA) | Oct | Sept | Y/Y | 2002 | 2001 | 2000 |
|---|---|---|---|---|---|---|
| Import - All Commodities | 0.1% | -0.4% | 0.9% | -2.5% | -3.5% | 6.5% |
| Petroleum | 2.3% | -5.0% | 3.4% | 3.0% | -17.2% | 66.5% |
| Non-petroleum | -0.1% | 0.2% | 0.7% | -2.4% | -1.5% | 1.0% |
| Export - All Commodities | 0.3% | 0.4% | 1.4% | -1.0% | -0.8% | 1.6% |
by Tom Moeller November 13, 2003
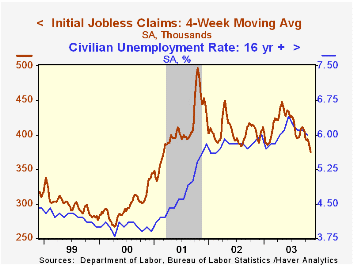
Initial claims for jobless insurance rose 13,000 to 366,000 last week. The gain only partially recouped a 38,000 decline the week prior. Consensus expectations had been for claims of 355,000.
The four-week moving average of initial claims fell to 375,250 (-7.8% y/y), the lowest level since March 2001.
Continuing claims for unemployment insurance rose 49,000 following a decline of 60,000 the prior week which was three times deeper than initially reported.
The insured rate of unemployment was stable at 2.8%.
| Unemployment Insurance (000s) | 11/08 | 11/01 | Y/Y | 2002 | 2001 | 2000 |
|---|---|---|---|---|---|---|
| Initial Claims | 366.0 | 353.0 | -8.0% | 404.3 | 406.0 | 299.7 |
| Continuing Claims | -- | 3,527 | -2.1% | 3,575 | 3,022 | 2,114 |
by Tom Moeller November 13, 2003
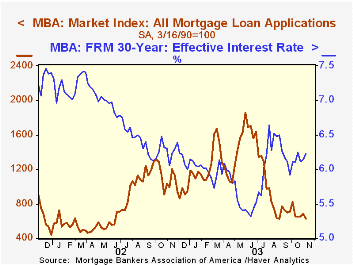
The index of mortgage applications compiled by the Mortgage Bankers Association dropped 8.6% last week (-36.9% y/y) to the lowest level since June 2002.
Purchase applications fell 7.1% (+12.6% y/y) and gave back most of the 11.1% jump the week prior. Applications to refinance plunged 10.1% (-56.8% y/y).
During the last ten years there has been a 54% correlation between the y/y change in purchase applications and the change in new plus existing home sales.
The effective interest rate on a conventional 30-Year mortgage rose w/w to 6.22%. The effective rate on a 15-year mortgage also rose w/w to 5.64%.
The Mortgage Bankers Association surveys between 20 to 35 of the top lenders in the U.S. housing industry to derive its refinance, purchase and market indexes. The weekly survey accounts for more than 40% of all applications processed each week by mortgage lenders. Visit the Mortgage Bankers Association site here.
| MBA Mortgage Applications (3/16/90=100) | 11/07 | 10/31 | 2002 | 2001 | 2000 |
|---|---|---|---|---|---|
| Total Market Index | 626.0 | 685.2 | 799.7 | 625.6 | 322.7 |
| Purchase | 375.4 | 404.3 | 354.7 | 304.9 | 302.7 |
| Refinancing | 2,084.2 | 2,319.4 | 3,388.0 | 2,491.0 | 438.8 |

Tom Moeller
AuthorMore in Author Profile »Prior to joining Haver Analytics in 2000, Mr. Moeller worked as the Economist at Chancellor Capital Management from 1985 to 1999. There, he developed comprehensive economic forecasts and interpreted economic data for equity and fixed income portfolio managers. Also at Chancellor, Mr. Moeller worked as an equity analyst and was responsible for researching and rating companies in the economically sensitive automobile and housing industries for investment in Chancellor’s equity portfolio. Prior to joining Chancellor, Mr. Moeller was an Economist at Citibank from 1979 to 1984. He also analyzed pricing behavior in the metals industry for the Council on Wage and Price Stability in Washington, D.C. In 1999, Mr. Moeller received the award for most accurate forecast from the Forecasters' Club of New York. From 1990 to 1992 he was President of the New York Association for Business Economists. Mr. Moeller earned an M.B.A. in Finance from Fordham University, where he graduated in 1987. He holds a Bachelor of Arts in Economics from George Washington University.
More Economy in Brief


