 Global| Nov 10 2009
U.S. Small Business OptimismImproves But Credit Remains Tight With Hiring Cautious
by:Tom Moeller
|in:Economy in Brief
Summary
Small business' optimism recently recovered from its recession low, but the latest readings indicate further, modest upside movement. The National Federation of Independent Business (NFIB) indicated that their small business optimism [...]
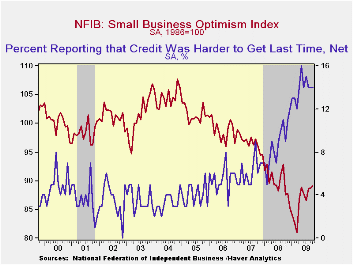 Small
business' optimism recently recovered from its recession low, but the
latest readings indicate further, modest upside movement. The National
Federation of Independent Business (NFIB) indicated that their small
business optimism index rose to 89.1 during October, the third
consecutive monthly gain. The latest level was the highest since
September '08. During the last ten years, there has been an
85% correlation between the level of the NFIB index and the two-quarter
change in real GDP.
Small
business' optimism recently recovered from its recession low, but the
latest readings indicate further, modest upside movement. The National
Federation of Independent Business (NFIB) indicated that their small
business optimism index rose to 89.1 during October, the third
consecutive monthly gain. The latest level was the highest since
September '08. During the last ten years, there has been an
85% correlation between the level of the NFIB index and the two-quarter
change in real GDP.
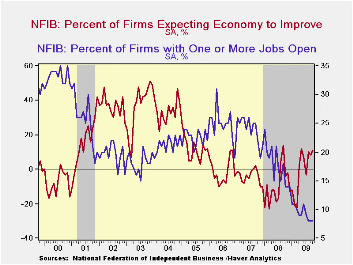 The
percentage of small businesses expecting the
economy to improve bounced back after earlier weakness to 11, the
highest since May. The percentage which thought that now was a good
time to expand the business slipped m/m to a still-improved 7, near the
highest level this year. Moreover, the percent reporting higher
net-earnings this quarter versus last year held at -40 m/m for the
third month, meaning fewer were reporting negative earnings versus last
year. It was the highest level since November.
The
percentage of small businesses expecting the
economy to improve bounced back after earlier weakness to 11, the
highest since May. The percentage which thought that now was a good
time to expand the business slipped m/m to a still-improved 7, near the
highest level this year. Moreover, the percent reporting higher
net-earnings this quarter versus last year held at -40 m/m for the
third month, meaning fewer were reporting negative earnings versus last
year. It was the highest level since November.
Tight credit conditions continued as 14% of firms indicated that it was harder to get credit. That was near the 1981 high of 15%. Perhaps because of these tight conditions, the recent improvement in business' sentiment has done little, if anything, to improve hiring intentions. The percentage of firms planning to raise employment remained in the net-layoff region and the percentage of firms with one or more job openings held at just 8% during October, the lowest level since 1982. During the last ten years there has been a 74% correlation between the NFIB employment percentage and the six-month change in nonfarm payrolls. Also to the downside, the percentage expecting credit conditions to ease slipped back to the February low.
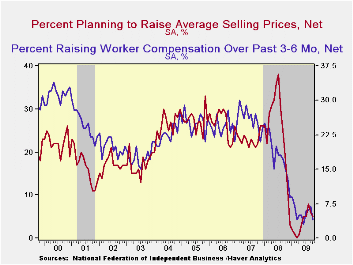 Pricing
conditions eased. The percentage of
firms actually raising prices improved to -17
(indicating deflation) and remained just above the record low. During
the last ten years there has been a 69% correlation between the
six-month change in the producer price index and the level of the NFIB
price index. The percentage of firms planning
to raise prices gave back the prior two months' improvement and fell to
a net 6, though that remained up from the March low of zero. Worker
compensation fell back to near its recent series' low.· The largest,
single most important problems seen by business were poor sales (33%),
taxes (22%, near the highest level since 2007), government requirements
(11%), insurance cost & availability (8%), competition from
large businesses (6%) and inflation (2%).
Pricing
conditions eased. The percentage of
firms actually raising prices improved to -17
(indicating deflation) and remained just above the record low. During
the last ten years there has been a 69% correlation between the
six-month change in the producer price index and the level of the NFIB
price index. The percentage of firms planning
to raise prices gave back the prior two months' improvement and fell to
a net 6, though that remained up from the March low of zero. Worker
compensation fell back to near its recent series' low.· The largest,
single most important problems seen by business were poor sales (33%),
taxes (22%, near the highest level since 2007), government requirements
(11%), insurance cost & availability (8%), competition from
large businesses (6%) and inflation (2%).
About 24 million small businesses exist in the United States. Small business creates 80% of all new jobs in America and the NFIB figures can be found in Haver's SURVEYS database.
Financial Regulation: Past and Future is the title of yesterday's speech by Fed Governor Daniel K. Tarullo and it can be found here here.
| Nat'l Federation of Independent Business | October | September | Y/Y | 2008 | 2007 | 2006 |
|---|---|---|---|---|---|---|
| Small Business Optimism Index (SA, 1986=100) | 89.1 | 88.8 | 1.8% | 89.8 | 96.7 | 98.9 |
| Percent of Firms Expecting Economic Improvement | 11 | 8 | -4 | -10 | -4 | -1 |
| Percent of Firms With One or More Job Openings | 8 | 8 | 14 | 18 | 24 | 25 |
| Percent of Firms Raising Avg. Selling Pric1es (Net) | -17 | -21 | 15 | 17 | 15 | 20 |
Inflationary Signals Abound;Gold& Oil Prices Strengthen While Dollar Weakens
by Louise Curley November 10, 2009
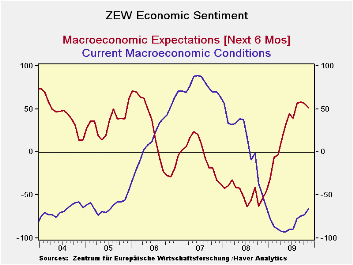 The
ZEW measure of confidence among German institutional investors and
analysts in the macroeconomic outlook six months ahead declined in
November to 51.1 from 56.0 in October. While the extent of
the decline was greater than expected, the optimists on the outlook
still outweigh the pessimists by 51.1%. A year ago the
pessimists outweighed the optimists by 53.5%. Moreover, the
current reading is well above the long term average of
26.9%.
The
ZEW measure of confidence among German institutional investors and
analysts in the macroeconomic outlook six months ahead declined in
November to 51.1 from 56.0 in October. While the extent of
the decline was greater than expected, the optimists on the outlook
still outweigh the pessimists by 51.1%. A year ago the
pessimists outweighed the optimists by 53.5%. Moreover, the
current reading is well above the long term average of
26.9%.
 Although
there has been some improvement in the
appraisal of current conditions, the majority of investors and analysts
still view current conditions negatively. The excess of
pessimists over optimists among the respondents declined to 65.6% in
November from 72.2% in October. The first chart shows the two
indicators: the macroeconomic outlook and current
conditions.
Although
there has been some improvement in the
appraisal of current conditions, the majority of investors and analysts
still view current conditions negatively. The excess of
pessimists over optimists among the respondents declined to 65.6% in
November from 72.2% in October. The first chart shows the two
indicators: the macroeconomic outlook and current
conditions.
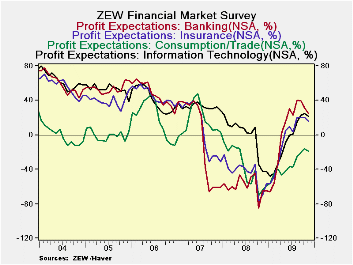
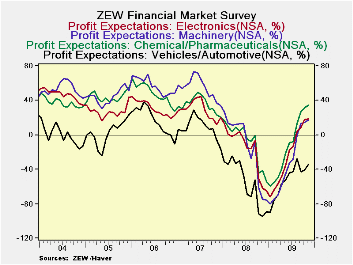 Some of
the reasons why the respondents have
become more cautious about the outlook may be found in their
appraisal of the profit prospects in the thirteen industries regularly
canvassed. In November, the respondents expected declines in
profits in seven of the industries and increases in six.
Declines in profits are expected in Banking, Insurance, Steel and
Metal, Consumption/Trade, Utilities, Telecommunication and Information
Technology. Increases in profits are expected in
Vehicles/Automotive, Chemicals/Pharmaceuticals, Electronics, Machinery,
Construction and Services. Selected industries where profits
are expected to decline are shown in the second chart and selected
industries where profits are expected to increase are shown in the
third chart. Profit expectations in the Banking and Insurance
industries have been declining since August and appear to have had the
biggest negative reappraisal.
Some of
the reasons why the respondents have
become more cautious about the outlook may be found in their
appraisal of the profit prospects in the thirteen industries regularly
canvassed. In November, the respondents expected declines in
profits in seven of the industries and increases in six.
Declines in profits are expected in Banking, Insurance, Steel and
Metal, Consumption/Trade, Utilities, Telecommunication and Information
Technology. Increases in profits are expected in
Vehicles/Automotive, Chemicals/Pharmaceuticals, Electronics, Machinery,
Construction and Services. Selected industries where profits
are expected to decline are shown in the second chart and selected
industries where profits are expected to increase are shown in the
third chart. Profit expectations in the Banking and Insurance
industries have been declining since August and appear to have had the
biggest negative reappraisal.
| ZEW INDICATORS (% Bal.) | Nov 09 | Oct 09 | Nov 08 | M/M Chg | Y/Y Chg | 2008 | 2007 | 2006 |
|---|---|---|---|---|---|---|---|---|
| Macroeconomic Expectations 6 Months Ahead | 51.1 | 56.0 | -53.5 | -4.9 | 104.6 | -47.5 | -3.0 | 22.3 |
| Current Conditions | -65.6 | -72.2 | -50.5 | 6.6 | -15.2 | 7.3 | 75.9 | 18.3 |
| PROFIT EXPECTATIONS | ||||||||
| Banking | 24.7 | 31.1 | -64.9 | -9.4 | 89.6 | -59.5 | -3.5 | 47.7 |
| Insurance | 16.4 | 19.8 | -70.1 | -3.4 | 86.5 | -45.4 | 9.7 | 46.0 |
| Chemicals/Pharmaceuticals | 34.8 | 31.6 | -41.6 | 3.2 | 76.4 | -8.6 | 35.3 | 48.3 |
| Vehicles/Automotive | -33.9 | -40.9 | -94.2 | 7.0 | 60.7 | -55.6 | 8.6 | 16.9 |
Inflationary Signals Abound;Gold & Oil Prices Strengthen While Dollar Weakens
by Tom Moeller November 10, 2009
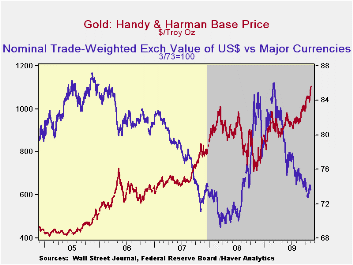 There's
little to suggest that current inflation is a problem for the U.S.
economy as consumer & producer prices remain weak.
Nevertheless, market signals suggest a future problem may be
developing. Higher gold prices are one of the more visible indicators
of pending inflationary power with its rise yesterday to an all-time
high of $1,107 per ounce. That strength has been accompanied by a drop
in the trade-weighted value of the U.S. dollar to its lowest level
since the summer of last year.
There's
little to suggest that current inflation is a problem for the U.S.
economy as consumer & producer prices remain weak.
Nevertheless, market signals suggest a future problem may be
developing. Higher gold prices are one of the more visible indicators
of pending inflationary power with its rise yesterday to an all-time
high of $1,107 per ounce. That strength has been accompanied by a drop
in the trade-weighted value of the U.S. dollar to its lowest level
since the summer of last year.
U.S. monetary & fiscal stimulus has done much to generate this inflationary scenario. Low interest rates and the propping up of the banking system have combined to generate an excessive 60% y/y rise in the monetary base and 12% y/y growth in the money supply (M1). Fiscal stimulus is more-than-evident in the budget deficit which ballooned last year to $680 billion and is projected by OMB to be around $1 trillion for the next ten years. Of course, monetization of this deficit is the worry.
 The end of
the U.S. recession
and of the recessions abroad have given rise to energy prices which
potentially could fuel higher inflation. Though they are down slightly
from the early-October high, crude oil prices at
an average $79.43 per barrel yesterday were up sharply from the
December low of $32.37. For all of last week the spot market price for
light sweet crude oil averaged $79.04 per barrel.
The end of
the U.S. recession
and of the recessions abroad have given rise to energy prices which
potentially could fuel higher inflation. Though they are down slightly
from the early-October high, crude oil prices at
an average $79.43 per barrel yesterday were up sharply from the
December low of $32.37. For all of last week the spot market price for
light sweet crude oil averaged $79.04 per barrel.
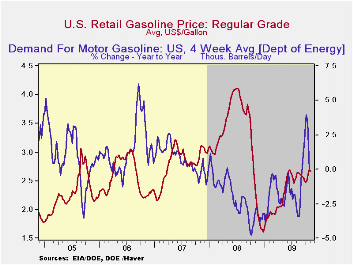
Consumers have seen
this pricing strength, and worries abound. The pump price for
regular gasoline slipped last week to $2.67 per gallon which
was slightly below the June high. However, prices remain up from the
December low of $1.61 and this week the wholesale gasoline price
remained firm at $1.97. Though gas prices were down slightly from the
October high of $2.10, worries abound about the future for pricing
power. 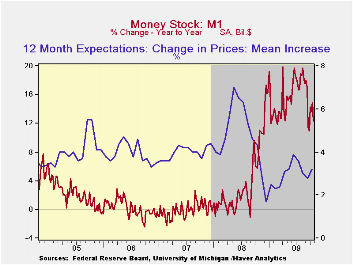 The expected rate of inflation for the next year has risen to
3.2%, roughly double the December low according to the University of
Michigan's survey. Finally, higher gasoline prices have prompted a
cutback in driving. Following earlier strength, the demand for motor
gasoline fell slightly last week from one year earlier. The energy
price figures are reported by the U.S. Department of Energy and can be
found in Haver's WEEKLY & DAILY databases.
The gasoline demand figures are in OILWKLY.
The expected rate of inflation for the next year has risen to
3.2%, roughly double the December low according to the University of
Michigan's survey. Finally, higher gasoline prices have prompted a
cutback in driving. Following earlier strength, the demand for motor
gasoline fell slightly last week from one year earlier. The energy
price figures are reported by the U.S. Department of Energy and can be
found in Haver's WEEKLY & DAILY databases.
The gasoline demand figures are in OILWKLY.
Natural gas prices also have strengthened ahead of the winter heating season. They slipped last week to an average of $4.27 per mmbtu (-36.6% y/y). Though they remained down by two-thirds from the high of $13.19/mmbtu reached in early-July of last year, they are more than double the low reached early last month. A bit of good news for the pricing outlook occurred yesterday. Prices natural gas slipped further to $3.87/mmbtu.
| Weekly Prices | 11/09/09 | 10/19/09 | Y/Y | 2008 | 2007 | 2006 |
|---|---|---|---|---|---|---|
| Retail Regular Gasoline ($ per Gallon, Regular) | 2.67 | 2.69 | 19.9% | 3.25 | 2.80 | 2.57 |
| Light Sweet Crude Oil, WTI ($ per bbl.) | 79.04 | 78.51 | 22.9% | 100.16 | 72.25 | 66.12 |

Tom Moeller
AuthorMore in Author Profile »Prior to joining Haver Analytics in 2000, Mr. Moeller worked as the Economist at Chancellor Capital Management from 1985 to 1999. There, he developed comprehensive economic forecasts and interpreted economic data for equity and fixed income portfolio managers. Also at Chancellor, Mr. Moeller worked as an equity analyst and was responsible for researching and rating companies in the economically sensitive automobile and housing industries for investment in Chancellor’s equity portfolio. Prior to joining Chancellor, Mr. Moeller was an Economist at Citibank from 1979 to 1984. He also analyzed pricing behavior in the metals industry for the Council on Wage and Price Stability in Washington, D.C. In 1999, Mr. Moeller received the award for most accurate forecast from the Forecasters' Club of New York. From 1990 to 1992 he was President of the New York Association for Business Economists. Mr. Moeller earned an M.B.A. in Finance from Fordham University, where he graduated in 1987. He holds a Bachelor of Arts in Economics from George Washington University.
More Economy in Brief


